
GENERAL MARKET COMMENTARY
Stocks started this year with a waterfall decline that turned into the worst 6-week January start in Wall Street history. This was likely due to the perception that the Federal Reserve was hinting at four more rate hikes in 2016. When they seemed to change their minds, the market took off and retraced the losses. At the end of April, the stock market has become the second longest bull market in US history. Only the tech bubble market in the 1990s lasted longer. Opinions are mixed as to whether we are in a bull or bear market, as prices peaked over a year ago. Historically, a bear market has seen a correction of 20% over a period of approximately 9 months. A case could be made that we have conceptually already seen this on the New York Stock Composite, which dropped over 18% from May 2015 to February 2016, a 9 month period. Lately, the market has been acting stronger than the current fundamental evidence, but the market always looks forward and leads the economy.
High yield bonds, after dropping 13% in the past year, have rallied back to make up half of those losses, and are now in sustained uptrends. Further gains should continue for this asset class unless signs of a recession become evident. If that should happen, we will move investors back to the safety of cash.
Our proprietary Market Environment Model has recently moved back into “Bull Market Environment” after having been in “Bear Market Environment” since July of 2015 (see chart below).
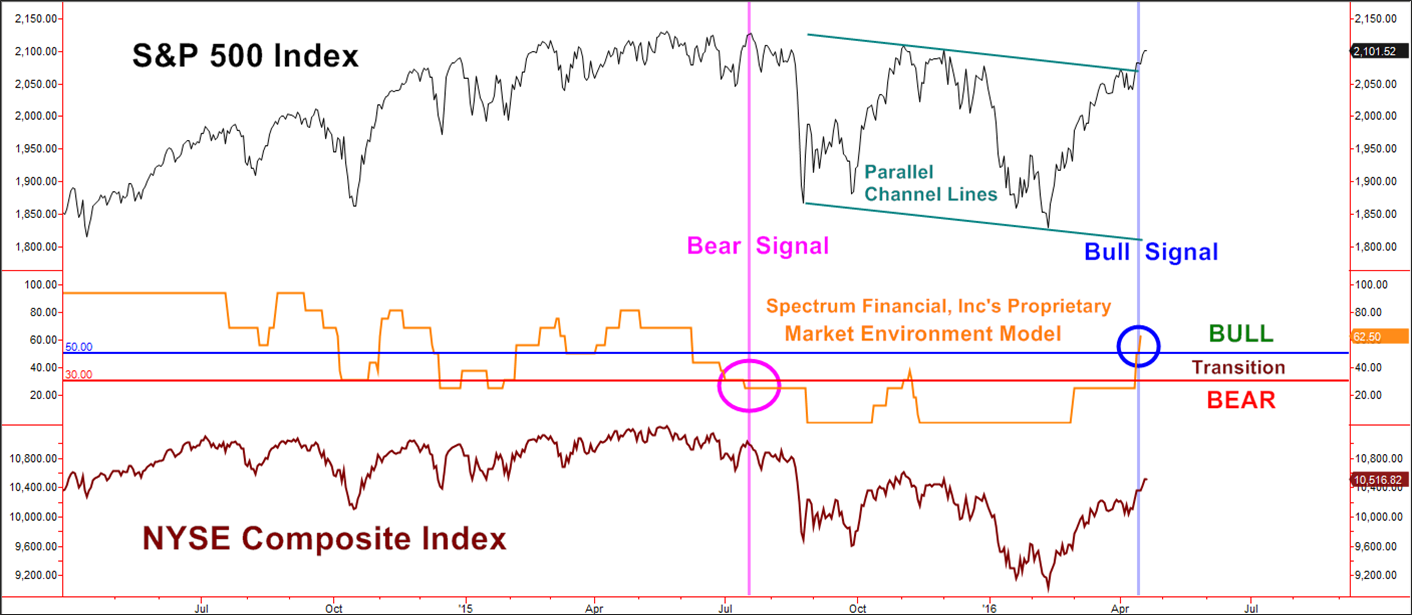
Created with TradeStation ©TradeStation Technologies, Inc. All rights reserved
The model goes beyond the simplified traditional definitions of market loss and gain. We believe better insight into the market’s health can be derived from a mixture of various factors from categories such as breadth, sentiment, trend persistence, and leadership measures.
While technical action has been favorable, some risks remain, including high valuations, lower corporate earnings, declining margin debt, and potential interest rate hikes by the fed.
It seems that the stock market has been following the price of oil. While many believe that lower oil prices result in better economic growth, that is not necessarily the case. Goldman’s economic model that looks at 3 trajectories for crude oil prices shows a surprising result. A $70/bbl oil price will result in stronger near-term US growth than if crude oil falls to $30/bbl. (see chart below).
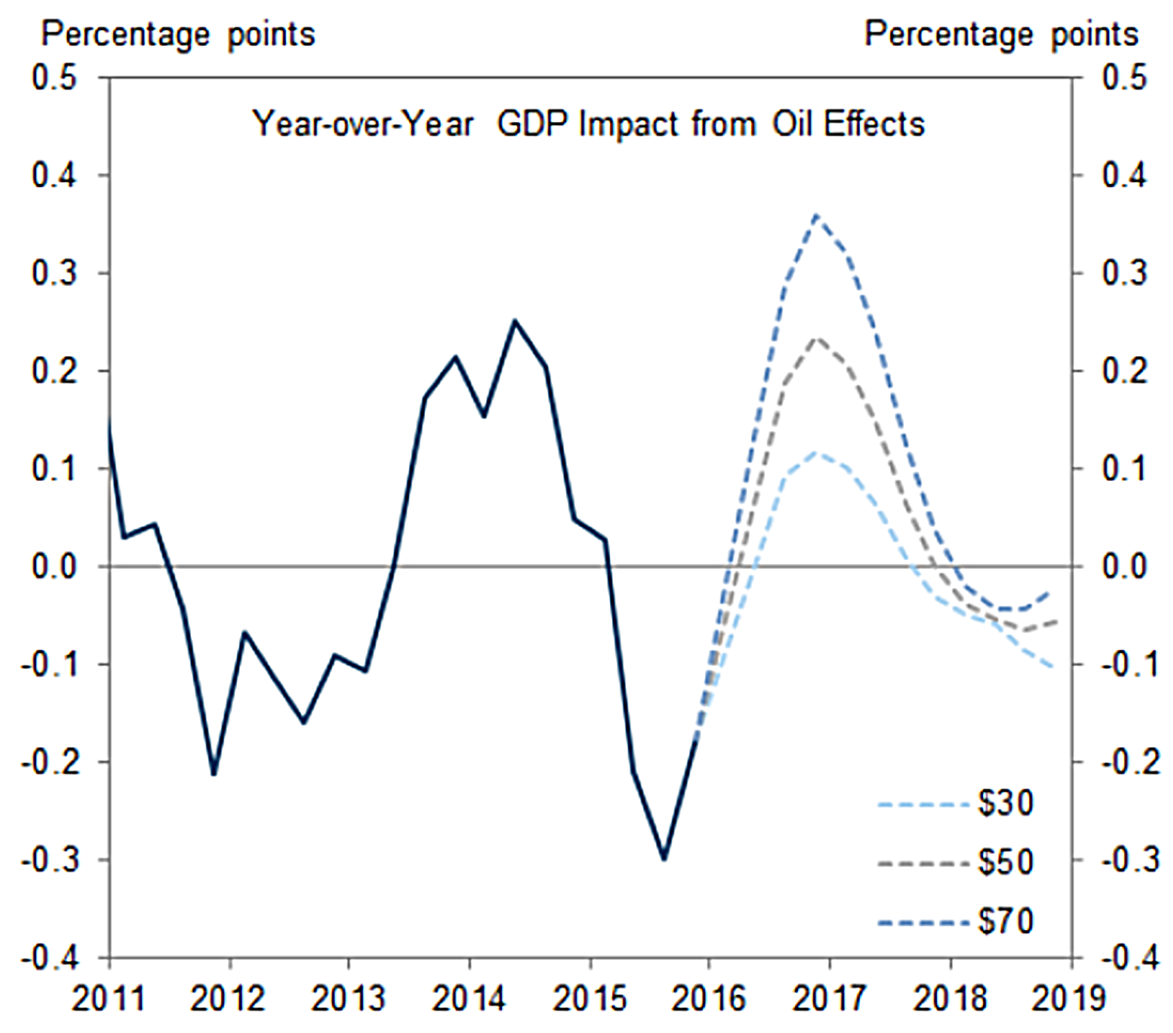
Source: Goldman Sachs
DYNAMIC HIGH YIELD TRADING SIGNALS
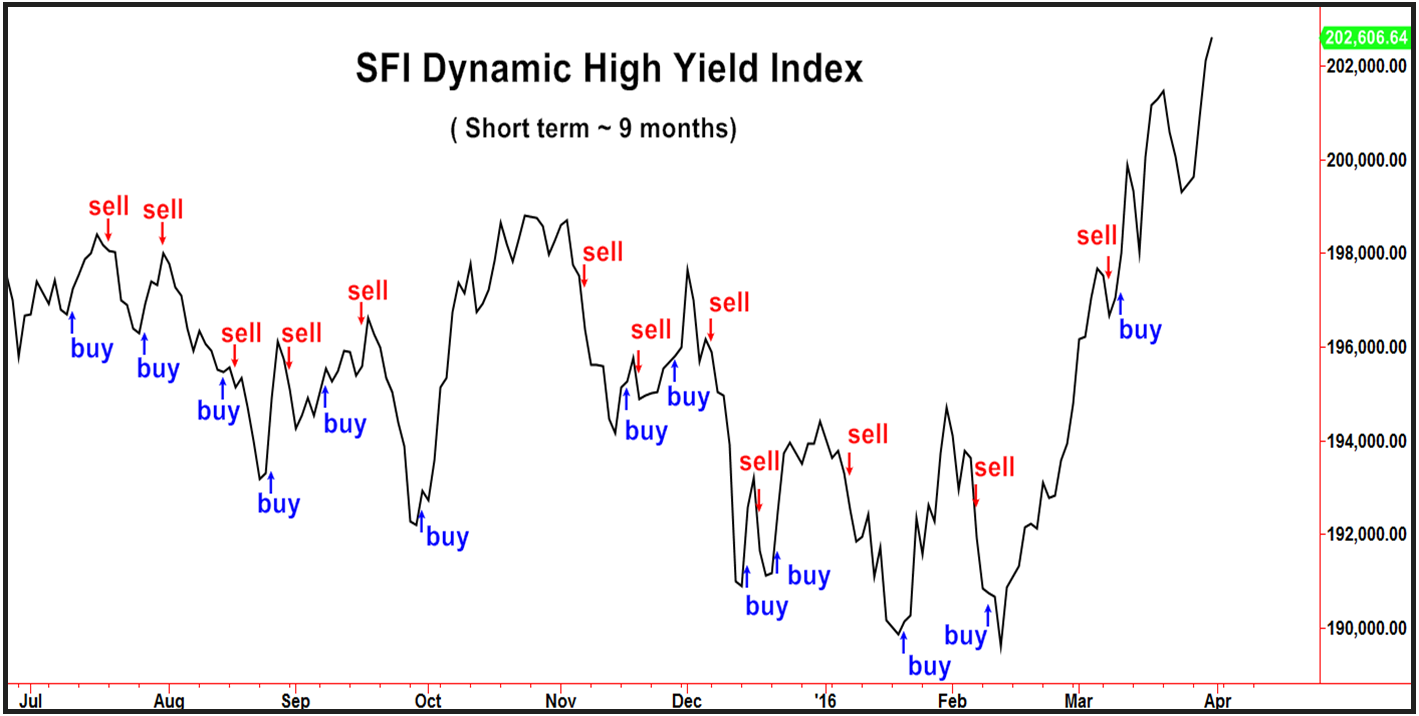
The chart below illustrates Spectrum’s short-term high yield trading strategy. Active trading minimizes losses, but allows profits to grow in a steady manner. By trading funds that allow short term trading, we are able to produce steady returns with less risk.
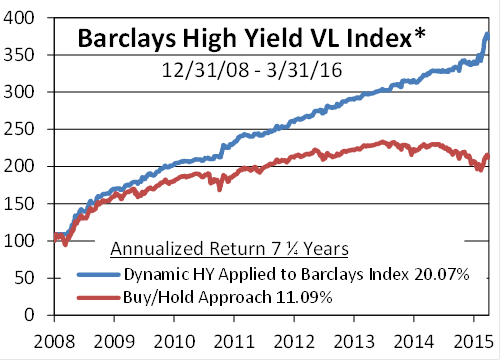
* Barclays High Yield VL Index: This benchmark includes publicly issued U.S. dollar denominated non-investment grade, fixed-rate taxable corporate bonds that have a remaining maturity of at least one year, regardless of optionality. The bonds are rated high-yield (Ba1/BB+/BB+ or below) using the middle rating of Moody’s S&P, and Fitch respectively (before July 1, 2005, the lower of Moody’s and S&P was used). Included issues consist of only the three largest bonds from each issuer that has a minimum amount outstanding of $500 million or more (face value) and less than five years from issue date.
The chart below illustrates our recent actual trading signals, which are applied to the SFI Dynamic High Yield Index from 12/31/08 to 3/31/16. You can see that Spectrum would have significantly outperformed a buy and hold approach with much less risk. While we cannot trade an index, we have traded other open-end high yield funds, which allow frequent trading. Results have varied depending on the fund used, but show consistently steadier returns than a buy and hold approach.
Created with TradeStation ©TradeStation Technologies, Inc. All rights reserved
SFI Dynamic HY Index is comprised of an equal weighting of the NAVs for FYAIX (Access Flex High Yield Fund) and RYHGX (Rydex High Yield Strategy Fund) mutual funds.
Disclosure
Spectrum Financial, Inc. is a Registered Investment Advisor. The Full Spectrum is published quarterly for its investors and account executives. This publication is not intended to offer or solicit investment advice, nor should anyone act upon any suggestions made herein, without individual counseling from your account executive regarding risks involved. There is no guarantee that the recommendations of management will prove to be as profitable in the future, as they have in the past. The information presented in this issue has been obtained from sources believed to be reliable, but its accuracy is not guaranteed. Due to various factors, including changing market conditions, the content may no longer be reflective of current opinions or positions. A copy of Spectrum’s current written disclosure statement discussing advisory services and fees is available upon request. All rights reserved, please notify when quoting.
This writing is for informational purposes only and does not constitute an offer to sell, a solicitation to buy, or a recommendation regarding any securities transaction, or as an offer to provide advisory or other services by Spectrum Financial, Inc. in any jurisdiction in which such offer, solicitation, purchase or sale would be unlawful under the securities laws of such jurisdiction. The information contained in this writing should not be construed as financial or investment advice on any subject matter. Spectrum Financial, Inc. expressly disclaims all liability in respect to actions taken based on any or all of the information on this writing. For full disclosure please see disclosures page here.