Month: March 2016 Page 1 of 2

How to Make Better Investment Decisions in Current Trends

Making better decisions usually entails some sort of the following:

  1. Current decisions are not cutting it & you are aware
  2. Perform analysis on WHY & WHERE in the process things are going wrong
  3. Get new information for your decision making formula: Alternatives
  4. Make a different decision

What are the Current Trends?

The 30-year Treasury Bond (pictured below) currently reflects the crosswinds of recent headlines. Improvement in the jobs data and consumer spending, while not consistently positive, point to traction in the economy. Some detractors to the positive traction have been the volatility in oil, slowed growth in China, and the threat to global commerce which could restrain the US from achieving a more robust economy.  When you have mostly consistent positive improvements but heavy weighted detractors you get a crosswind environment. You can see these factors charted against the 30-year Treasury Bond below.Weekly Blog

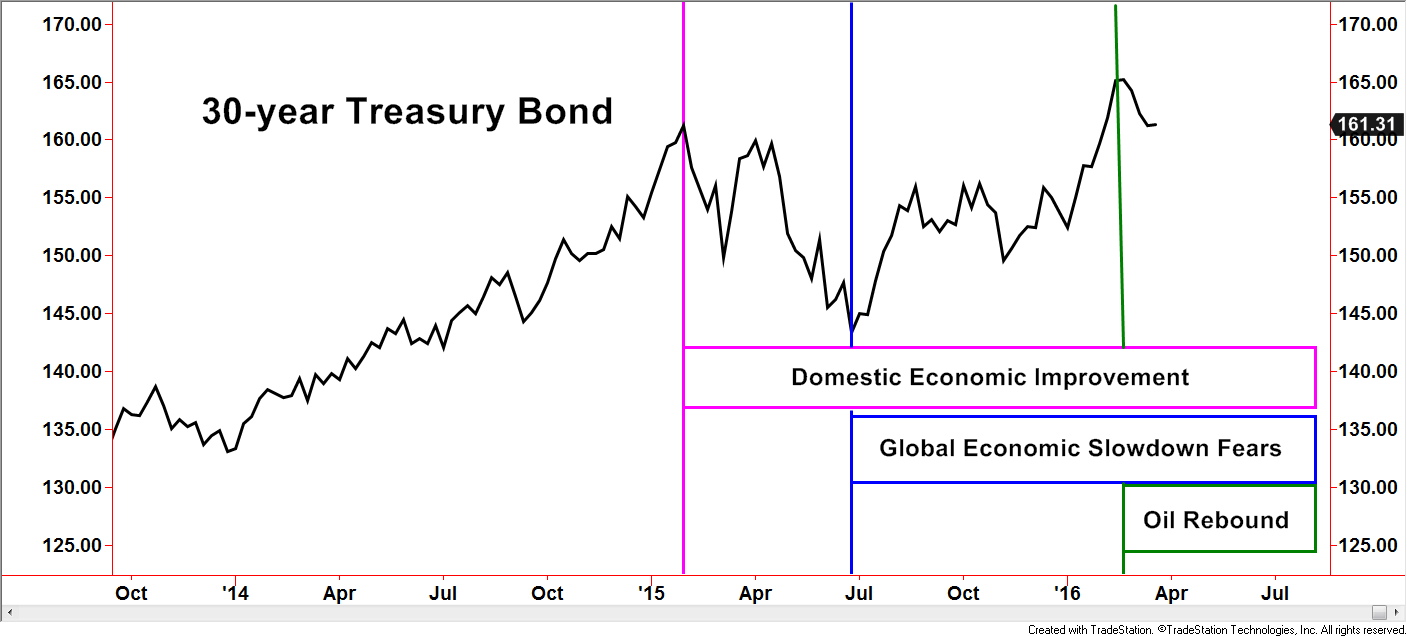
Bond prices tend to trend lower during periods of economic expansion and prices tend to rise during periods of heightened uncertainty. The new environment we are seeing in the markets is a condensed, extreme version of this cycle. Down Up, Down Up.

The chart above displays a large sideways pattern after the steady climb during 2014.

pnik arrowThe pink box indicates when investors perceived an improvement in the domestic economic condition starting Quarter 1 in 2015.

blue arrowSince summer of 2015, however, fears of a global economic slowdown were an influence to higher prices and lower yields (blue box)

green arrowOver the last month, bond prices have eased lower as oil prices have experienced a mild rebound (see green box).

There are many other factors that have played roles of influencing prices. However, the forces mentioned above seem to have a stronger impact over others, not to mention the additional impacts added daily- much like the recent Federal Reserve Meeting last week.

Blending all these influences together creates the crosswinds that make up the path of the market.

Flexibility & Price Movement

Eventually, the short, intermediate, and longer-term trends will get on the same page but we do not know when that will be, nor do we need to be skilled at such forecasts. (See Why here)

Some investors perform extensive research into macro-economic models, only to be subjected to the crosswinds that can push around bond price. A weakness of macro-economic models is the negative impacts to a portfolio while investors wait for their models to possibly yield desired results.  Instead of relying on correct predictions through an economic model, flexible methods rooted in the information derived from price action and sentiment evaluated over different time frames can create better risk/reward opportunities.

The price movement of securities, and in this case bonds, are inclusive of economic impacts whether it is the Federal Reserve, Chinese economics, the oil market, or combination of these events.

For example, further declines in treasury bond prices generally have positive influences on growth assets such as high yield, preferred stocks and domestic equities. Additional signs of economic instability, domestic and foreign, could lead to a rise in treasury bond prices as well as other higher rated bond classes.  Methods employed by our management not only assess where to invest but also incorporate the time frame factors of long, intermediate, and short terms.

Successful investing does not require predicting an outcome, but having a sound plan of action in place improves the odds of success

The Take-Away:

How do you make better investment decisions in current trends?

  • Know the current market environment for which you are investing
  • Use flexible/agile models that evaluate different time frames
  • Use tools that are efficient and inclusive of other data like price movement

The Spectrum Fund’s Strategy Snapshot

Spectrum Low Volatility Fund

Allocation

The Spectrum Low Volatility Fund (SVARX) focuses mostly on investments in the domestic fixed-income and credit markets but can invest globally. The management team navigates the various bond classes as each tend to have specific characteristics regarding price action and market impacts. The attempt at a bottom by high yield and float investments in late January had SVARX entering February with a mix of smaller, newly established positions in those two categories. Some exposure was maintained in the bond categories that had been trending higher back in January and earlier, primarily government bonds that included agency and municipals. Exposure remained defensive throughout the month. This mix of economic growth oriented and capital preservation oriented bond categories helped maintain an NAV with low volatility characteristics in February as overall market volatility increased and minor trend reversals were seen in various bond classes.

Picture2

Spectrum Advisors Preferred Fund

The Spectrum Advisors Preferred Fund (SAPEX) was active in February, which is in line with the concept of navigating risk and investment opportunities typically seen in the higher volatility market environments with bearish characteristics. Among tactical trades, a core equity fund was sold and hedging methodologies were stepped up during this period deemed “defensive” by management. Exposure ramped up quickly mid-month as technical methodologies flagged overly pessimistic extremes with favorable risk/reward trading parameters. Despite the exposure increase, management capped exposure levels in order to stay in line with perceived higher risk levels of the prevailing market environment.

Picture3

Picture4

DISCLOSURES

3S&P 500 TR Index is a capitalization weighted index of 500 stocks representing all major domestic industry groups. It is not possible to directly invest in any index. The S&P 500 TR assumes the reinvestment of dividends and capital gains. It is not possible to directly invest in any index.

4S&P LSTA U.S. Leveraged Loan 100 Index: This benchmark is designed to reflect the performance of the largest facilities in the U.S. dollar leveraged loan market. Term loans from syndicated credits must meet the following criteria at issuance to be eligible for inclusion. 1) senior secured 2) minimum initial term of one year 3) minimum initial spread of LIBOR +125 basis points 4) U.S. dollar denominated 5) all constituents must have a publicly assigned CUSIP.

Barclays US High Yield VLI Index: includes publicly issued U.S. dollar denominated non-investment grade, fixed-rate taxable corporate bonds that have a remaining maturity of at least one year, regardless of optionality. The bonds are rated high-yield (Ba1/BB+/BB+ or below) using the middle rating of Moody’s, S&P, and Fitch, respectively (before July 1, 2005, the lower of Moody’s and S&P was used). Included issues consist of only the three largest bonds from each issuer that have a minimum amount outstanding of $500 million or more (face value) and less than five years from issue date.

550/50 Barclays VLI HY/S&P LSTA U.S. Leveraged Loan 100 Index: This benchmark gives 50% weight to the Barclays VLI HY Index and 50% weight to the S&P Leveraged Loan Index. (see above)

660/40 NYSE Composite/Barclays U.S. AGG. Bond Index: This benchmark gives 60% weight to the NYSE Composite Index and 40% weight to the Barclays U.S. Agg. Bond Index. The NYSE Composite Index (NYA) measures the performance of all stocks listed on the New York Stock Exchange. It includes more than 1,900 stocks, of which over 1,500 are U.S. companies. Its breadth therefore makes it a much better indicator of market performance than narrow indexes that have far fewer components. The weights of the index constituents are calculated on the basis of their free-float market capitalization. The index itself is calculated on the basis of price return and total return, which includes dividends. The Barclays U.S. Aggregate Bond Index measures the underlying index and performance of the total U.S. investment grade bond market. It is a market value-weighted index that tracks the daily price, coupon, pay-downs, and total return performance of fixed-rate, publicly placed, dollar denominated, and non-convertible investment grade debt issues with at least $250 million per amount outstanding and with at least one year to final maturity.

The performance data quoted represents past performance; past performance does not guarantee future results; the investment return and principal value of an investment will fluctuate; an investor’s shares, when redeemed, may be worth more or less than their original cost; current performance may be lower or higher than the performance quoted. Please call 1-866-842-4860 for monthly performance updates.

An investment in a mutual fund involves risk, including loss of principal. There is no guarantee any investment strategy or the funds will meet their investment objectives of generating profits or preventing loss. The risks associated with the Funds are detailed in the prospectus which include risks of the Sub adviser’s investment strategy, aggressive investing techniques, high portfolio turnover, investing in ETF’s, investing in other investment companies, swap agreements, asset-backed securities, leverage, shorting and non-diversification. Aggressive investing techniques would include the use of futures, enhanced betas and shorting securities. Shorting occurs when investors sell securities they do not own and are committed to repurchasing eventually. Because the Fund’s holdings include small-cap, mid-cap, and international equities, there are additional risks such as the possibility of greater price volatility and reduced liquidity, fluctuations in currency exchange rates, and political diplomatic and economic conditions as well as regulatory requirements in foreign countries. There are additional risks associated with investing in instruments rated below investment grade (i.e., junk bonds) because such instruments generally involve greater risk of default or price changes than other types of fixed-income instruments, therefore the Fund’s performance may vary significantly as a result.


An investor should consider the investment objectives, risks, charges, and expenses of The Spectrum Funds carefully before investing. The prospectus contains this and other information about The Spectrum Funds. To obtain a prospectus please call Ceros Financial Services 866-842-4860. The prospectus should be read carefully before investing. Date of first use: March 11, 2016.


Page 1 of 2

Spectrum Financial, Inc 2023