After an overly optimistic start in the month of January the markets have corrected in a volatile decline, the likes of which we have not seen in several years. The combination of euphoric buying, overvalued stock prices, and the realization that the Federal Reserve will be raising interest rates several times this year to fight inflation contributed to a severe selloff and extreme market volatility. In 9 days the Dow Jones Average has dropped 10%, one of the fastest corrections in history. This follows a period of over 500 days of not having a 10% correction. The longer the market goes without a correction, the more violent it can be to work out the excesses in the financial system. While the majority of the time a situation like this leads to favorable returns over the 12-month period following a correction, there are a number of times when very nasty things happen. A majority of the investment managers today are younger and have not experienced what can happen to buy and hold investors. More recently, in the past 20 years, we have had two stock market corrections in excess of 50%. This kind of activity can cause investors who have buy and hold portfolios to change their lifestyle.
Current Portfolio Updates show reduced exposure to portfolios prior to the correction:
Spectrum High Yield Bond Strategy: Exposure was moved to the safety of the money market on Feb 2.
Spectrum Dynamic High Yield Bond Strategy: exposure continues to take advantage of shorter term movements while maintaining a strict focus on risk management
Spectrum International Sector Strategy: exposure to volatile equity sectors has been reduced and exposure to alternative risk-adjusted sources has been maintained.
Spectrum Core Focus Strategy: continues its hedge equity exposure due to unchanged macro themes despite the heightened volatility.
The Spectrum Low Volatility Fund: SVARX had no high yield bond or stock exposure for the decline, and leverage of other credit positions has been eliminated. It remains the number 1 ranked U.S.-domiciled nontraditional bond fund by Morningstar out of 280 funds for the past three years date ending 2/8/18*. Please visit www.thespectrumfunds.com for more information and fund documents.
The Spectrum Advisors Preferred Fund: SAPEX, our alternative equity fund, transitioned exposure out of traditionally higher beta positions while still maintaining exposure for this macro bull market trend. The fixed income exposure has been reduced due to the few fixed income sectors having acceptable technical characteristics. Please visit www.thespectrumfunds.com for more information and fund documents.
The Hundredfold Select Alternative Fund: SFHYX/HFSAX, managed by Hundredfold Advisors, LLC (Ralph Doudera, Portfolio Manager), also has little high yield bond exposure and very modest stock exposure. Leverage of credit positions has also been eliminated. The alternative exposure has actively managed the commodities space maintaining the objective of low volatility. Please visit www.hundredfoldselect.com for more information and fund documents.
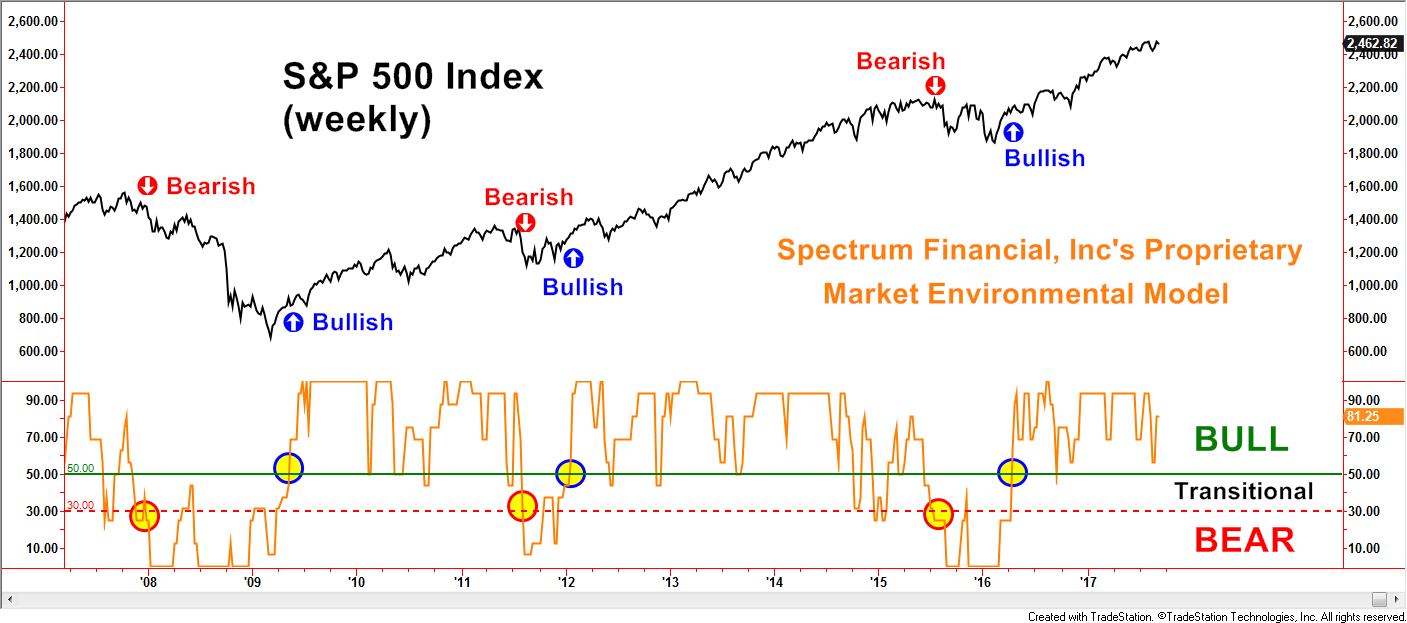
Our portfolios are very actively managed. Spectrum has been managing risk for over 30 years, and has seen about every market condition imaginable. Our primary concern is not making lots of money, but by providing superior risk adjusted returns for clients. We want clients to know that they don’t have to pay attention to market volatility because that is what we do best. While this correction may be just a hiccup on the way to new high prices, it may also be the beginning of a bear market. Bear markets begin with extended prices, and optimism. Our Bull/Bear monitoring system this week raised the caution flag after several years, but has not gone to the sell side yet. It is in a wait and see mode. Any investors who are buy and hold stock investors need to think through whether or not a 50% decline in their account will change their lifestyle, and if so, pay attention. Remember almost every bull market has eventually had a correction of about 50% of the gains, and this market is up 300% since 2009.
Remember: Steady plodding brings prosperity, hasty speculation brings poverty. Proverbs 21:5
*© 2017 Morningstar, Inc. All Rights Reserved. The information contained herein: (1) is proprietary to Morningstar; (2) may not be copied or distributed; and (3) is not warranted to be accurate, complete or timely. Neither Morningstar nor its content providers are responsible for any damages or losses arising from any use of this information. Past performance is no guarantee of future results.