

The transition from January to February was tumultuous, with volatility spiking 100% in a single day, and the Dow Jones Industrial Average posting its largest one day point drop in history. The panic was short lived however, as equities bottomed mid-month and rebounded sharply. Much of this was attributed to the rising 10-year Treasury yield which hit a 4-year high, and concerns over increased inflation as wage data and CPI (Consumer Price Index) readings came in hot. Declines were seen across the board, impacting not only domestic equity and fixed income sectors, but around the globe including a drop in commodity prices. Investor outlook appears to be edging back to bullish, but the recent shakeup has taken its toll on sentiment.
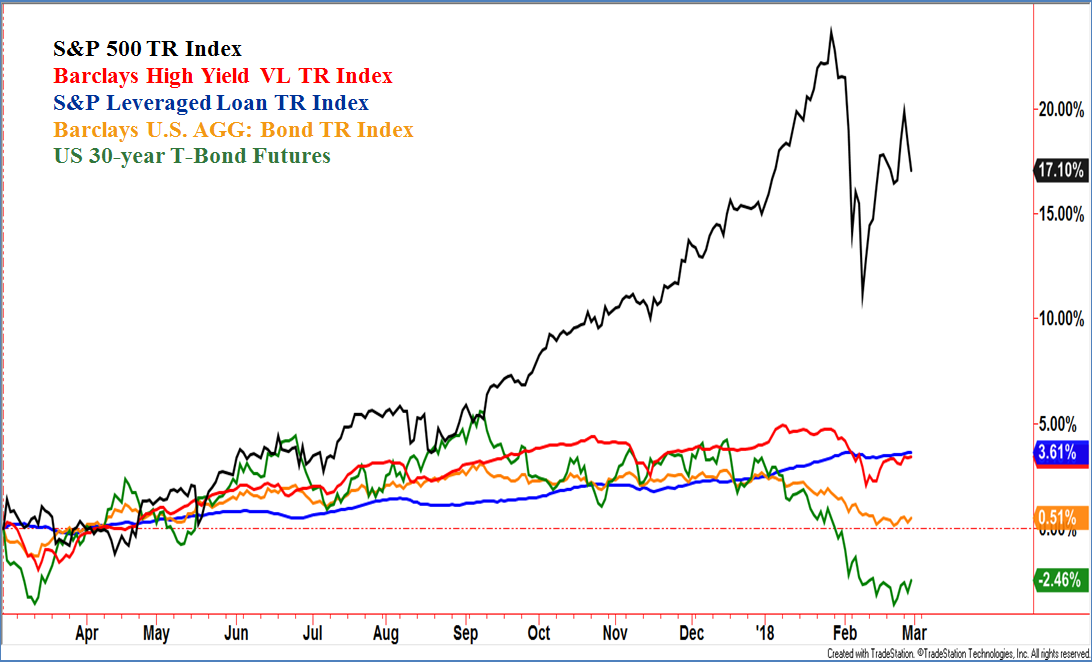
The sharp correction in the stock market allowed for interesting insights within the bond market. Investment grade bonds, represented in the chart above by the Barclays U.S. Aggregate Bond TR Index, and the US 30-year Treasury Bond Futures often benefit from equity market turbulence as fearful investors seek the relative safety of those bonds classes. In February, however, that did not occur. This is perhaps due to the perception that a macro change to rising rates could erode the value of these interest sensitive bond classes. The S&P Leveraged Loan TR Index weathered the February storm well as the class is generally perceived as having the ability to adjust to rising interest rates. High yield bonds have benefited from low default rates as the growing economy has strengthened corporate balance sheets. With yield spreads being tight, however, potential investors are currently being less compensated for risk. This has made high yield bonds more sensitive to interest rate fluctuations, hence the increased volatility over the last twelve months. Many other bond classes exist beyond what is being displayed in the chart above, but most fall under the same market forces as described. Few bond categories are currently displaying leadership, but such transitional environments tend to be temporary and new trends will eventually emerge.
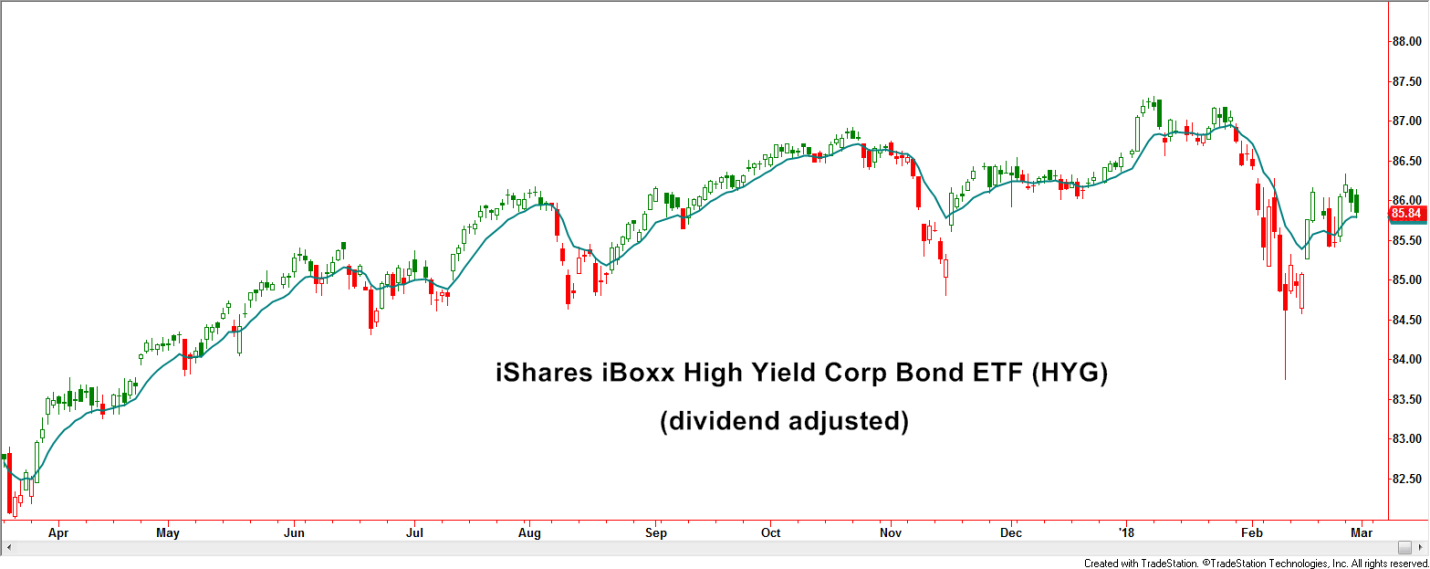
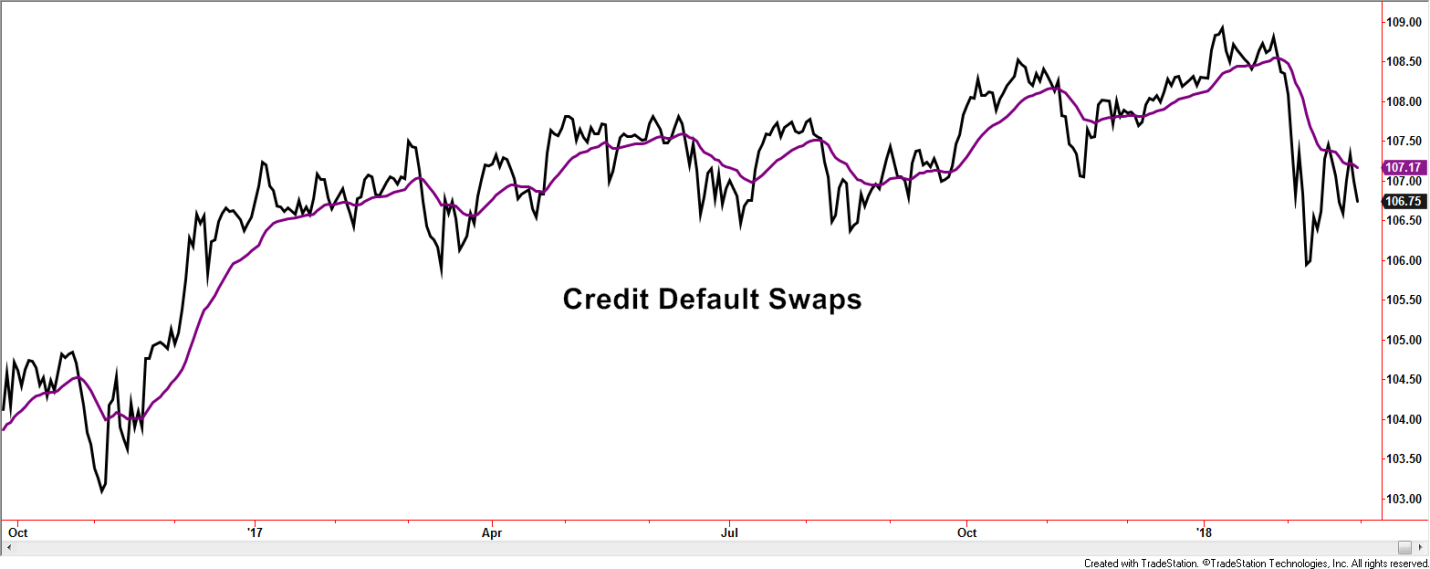
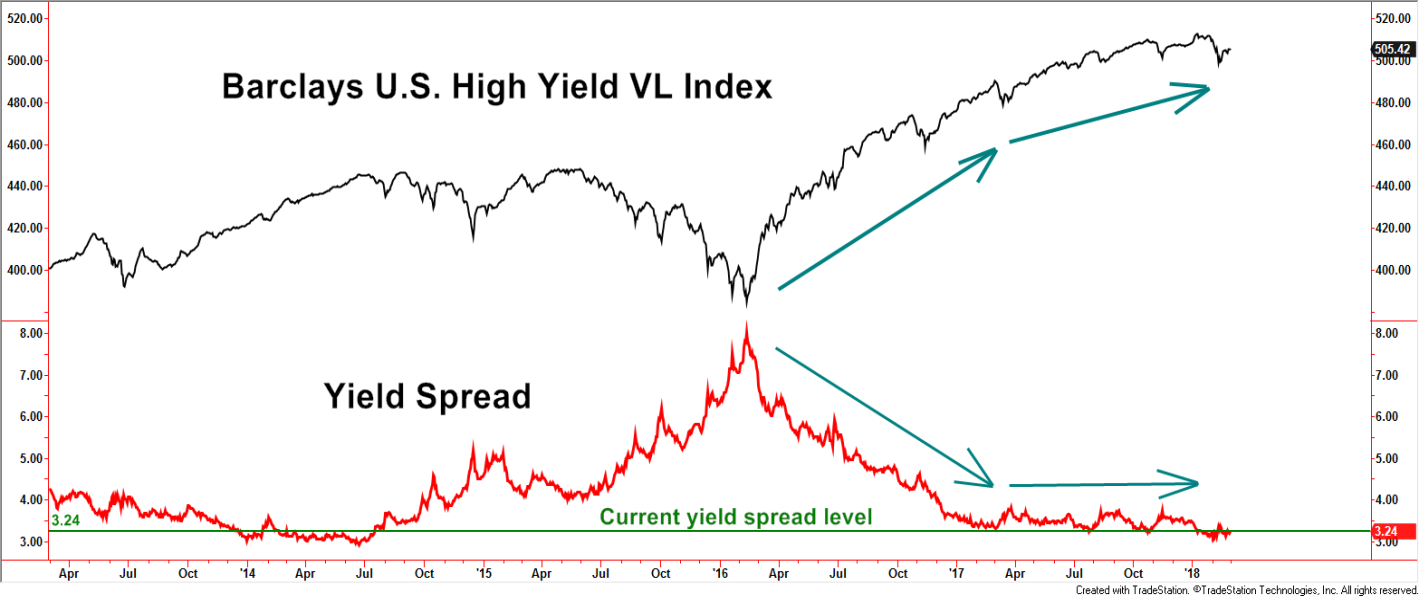
The charts above represent several categories within the high yield market. By looking at multiple categories, information regarding risk can be assessed which plays a role within Spectrum strategies.
Products such as the iShares iBOXX High Yield Bond ETF (HYG) and Credit Default Swaps tend to be more sensitive to changes in investor sentiment. Volatility and trends are monitored to assess the odds of a continued bullish outcome. The yield spread is another measure of investment risk. Generally speaking, it measures the difference in yield between treasury bonds and high yield bonds. Spreads widen when investor fear is heightened, sometimes for valid, longer-term reasons, and sometimes for short-lived, more emotional reasons. A favorable environment is characterized by declining yield spreads. This was the case for 2016. The trend changed in early 2017 with a shift into a rather tight range and remained that way throughout the year. An improving economy has been a positive underpinning for high yield bonds but the sideways range in the yield spread has removed one of the formerly favorable characteristics. That can help explain the continued uptrend in high yield bonds but at a lesser slope. A break to the upside by the spread, could possibly play a role in defining a more challenging period for high yield bonds.
Our strategies have various requirements before taking positions. The Dynamic High Yield Strategy often takes advantage of the shorter-term opportunities while the High Yield Strategy generally waits for lower volatility and more discernable positive trends. The Leveraged High Yield Strategy incorporates elements of both.
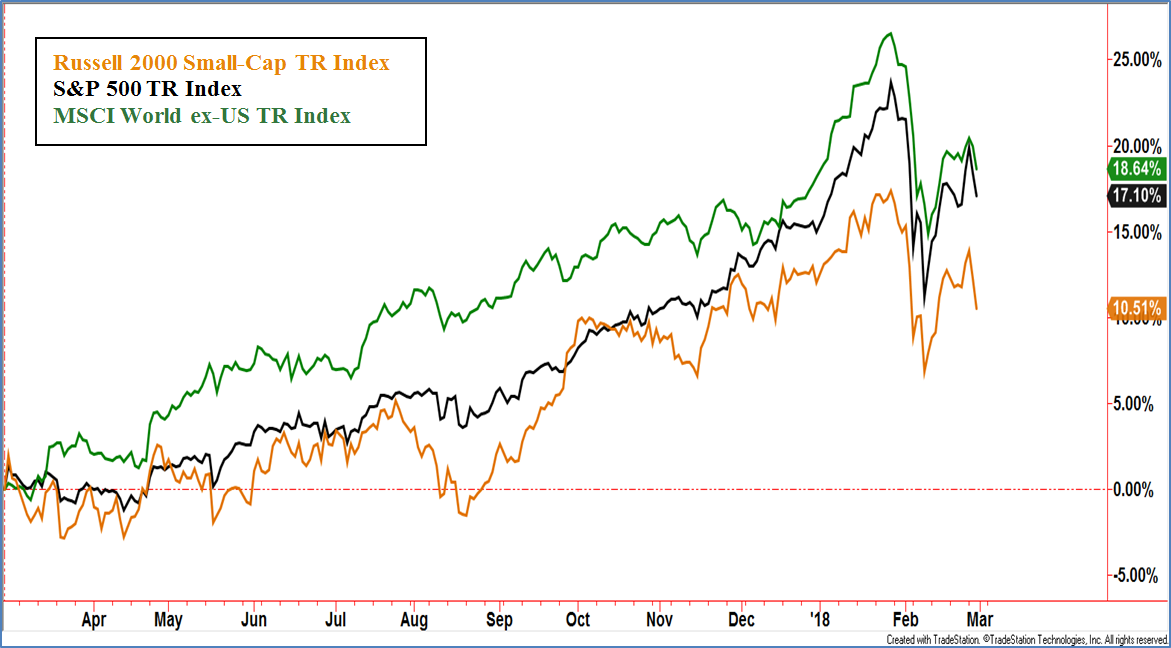
Major equity indexes around the globe were very volatile in February as crowded trades built on over exuberance gave way to fearful selling. Non-U.S. equities also had the unfavorable influence of a shaky, but upward, bias in the U.S. Dollar. Macro trends have become questionable, not full bullish and not fully bearish, as most major indexes ended February around the middle of multi-month trading ranges.
SecurityMaxx Strategies – An Inside Look
HIGH YIELD BOND
This strategy became invested in early January but the momentum loss in late January prompted a relatively quick exit by very early February and remained in cash for the remainder of the month.
LEVERAGED HIGH YIELD BOND
The strategy began the month with only core positions invested but quickly exited to the safety of cash as risk parameters moved beyond acceptable levels.
DYNAMIC HIGH YIELD
This nimble strategy sold to cash very early in February, but oversold readings soon warranted an invested position that remained throughout the rest of the month.
INTERNATIONAL SECTOR
Overall, exposure was reduced in emerging and developed foreign markets but smaller tactical trades were implemented as opportunities arose, primarily in the emerging markets.
CORE FOCUS
The Major Trend Index (MTI) slipped from positive to neutral as a result of weakening in the Momentum/Breadth indicators. If the MTI does not improve to positive, the discipline requires a reduction in stock exposure from the current 60% allocation. If concerns about trade tariffs persist, the current large cap stock bias can shift to small cap stocks that are less impacted by import/export relationships. Current small cap exposure is only 10% of the total portfolio.
|
BENCHMARK PERFORMANCE |
TOTAL |
TOTAL |
|
Feb |
YTD |
|
| Barclays High Yield VL TR Index |
-0.90% |
-0.57% |
| All US Domestic Equity Funds (Avg. US Stock Fund) |
-3.61% |
0.57% |
| NASDAQ Composite TR Index (w/dividends) |
-1.74% |
5.54% |
| S&P 500 TR Index (w/ dividends) |
-3.69% |
1.83% |
| MSCI World ex USA TR Index |
-4.70% |
0.62% |
Barclays U.S. AGG: Bond TR Index is a market capitalization-weighted index comprised of USD-denominated, investment-grade, fixed-rate, taxable bonds. The index includes government securities, mortgage-backed securities, asset-backed securities and corporate securities all with a maturity of greater than one year.
Barclays High Yield VL TR Index includes publicly issued U.S. dollar denominated non-investment grade, fixed-rate taxable corporate bonds that have a remaining maturity of at least one year, regardless of optionality.
S&P/LSTA U.S. Leverage Loan 100 TR Index comprised of the 100 largest bank loans with floating rate coupons.
iShares iBoxx High Yield Corporate Bond ETF (HYG) which seeks to track the investment results of an index composed of U.S. dollar-denominated, high yield corporate bonds.
CDS (Credit Default Swaps) a financial contract whereby a buyer of corporate or sovereign debt in the form of bonds attempts to eliminate possible loss arising from default by the issuer of the bonds. This is achieved by the issuer of the bonds insuring the buyer’s potential losses as part of the agreement.
Standard and Poor’s 500 TR Index (S&P500) is a capitalization weighted index of 500 stocks representing all major domestic industry groups and assumes the reinvestment of dividends and capital gains.
NASDAQ Composite TR Index is a broad-based capitalization-weighted index of stocks in all three NASDAQ tiers: Global Select, Global Market, and Capital Market.
All US Domestic Equity Funds: Is an arithmetic average of all US Domestic Equity Mutual Funds, provided monthly by the Wall Street Journal
Russell 2000 Small-Cap TR Index measures the performance of the small-capitalization sector of the U.S. equity market.
MSCI World ex USA TR Index (MXWDU) is a capitalization weighted index that monitors the performance of stocks from around the world other than the US.
Major Trend Index (MTI, developed by The Leuthold Group LLC) is designed to recognize major market trends rather than intermediate moves, combining over 180 individual components to assess the overall health of the stock market. It includes Intrinsic Value Indicators, Supply/Demand Tools, Market Action Tools, Attitudinal Gauges, and Economic/Interest Rates/Inflation Measures. Revisions and weighting adjustments are made from time to time.