
Markets have historically had psychological booms and busts since the beginning of time. The fear/greed syndrome will continue to drive investors into making emotional decisions at the wrong time. Human nature will remain the same. Mania has always gripped the markets from season to season. Gold, tulip bulbs, real estate, tech, oil. Bubbles tend to develop, and while “bubbles” can continue a lot longer than predicted, they will all come to a very unpleasant ending. For example, Japan’s market hit it’s high in 1989 and 18 years later it was still down 55% from its high. Knowing which markets to avoid and when to exit them is an important philosophy to have present in a portfolio. While I expect the markets to continue their bull market run, we always need to sit close to the exits when technical market conditions deteriorate.
In April of 2007, I wrote the paragraph above in our quarterly newsletter to our clients. In January of 2008 we received our bear market signal and saved clients a lot of money by going to cash. Liquidity is a pillar of risk management, and our clients were positioned to make double digit returns in 2009. In 2017 I have the same feelings: While I expect the markets to continue their bull market run, we always need to sit close to the exits when technical market conditions deteriorate.
The chart below illustrates our Market Environment Model. This model has indicated a bull market environment since early 2016, following a significant market sell-off beginning in mid-2015. The indicators that we utilize illustrate higher market risk, and can cause us to significantly reduce exposure to stocks. We currently use a proprietary combination of four components: (1) Moving average model of major equity indexes, (2) Weekly Directional Movement Index model, which defines the quality of the trend, (3) Negative Leadership Composite as defined by Investech, and (4) Spectrum’s High Yield Bond signal, which confirms a healthy economy. These four indicators together are not a forecasting device, but they give us insight into levels of market risk. Depending on this evaluation, we adapt trading strategies to become more aggressively invested or more defensive to reduce risk.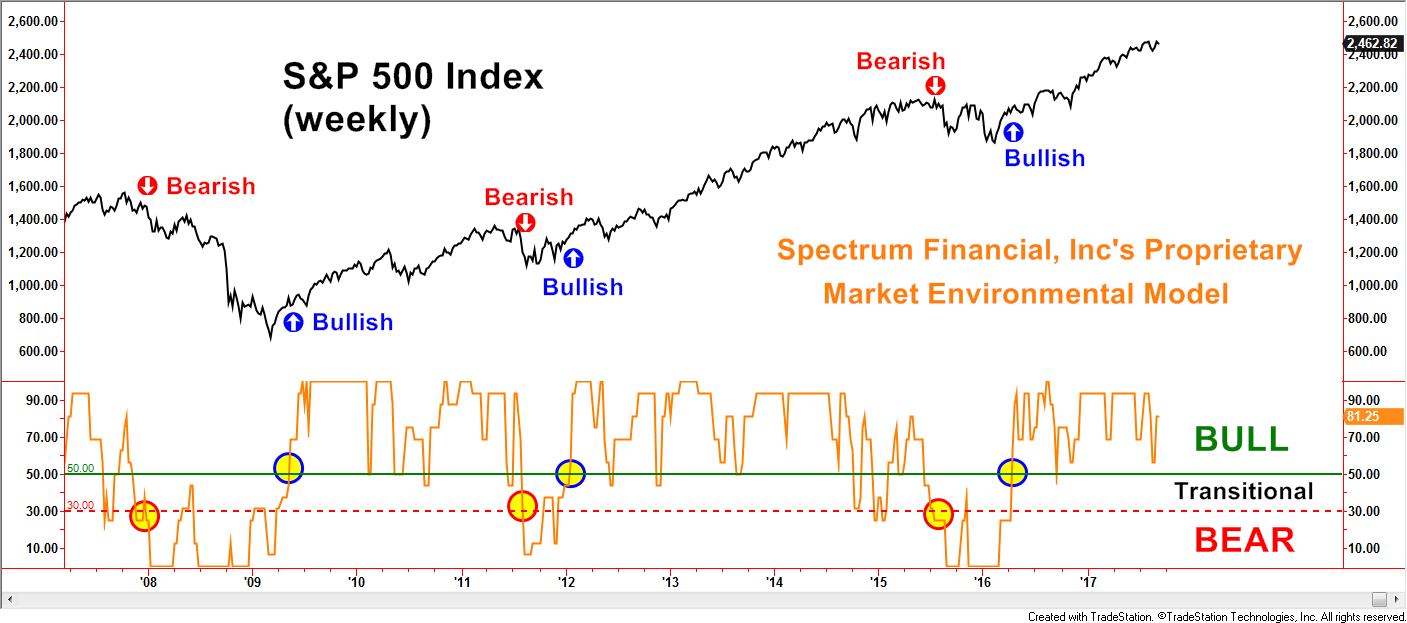 Created with TradeStation. © TradeStation Technologies, Inc. All rights reserved.
With the stock market hitting new highs, investors are beginning to get overly-excited about this bull market. Since 1932, there have been 16 bull markets, the average of which lasted 3.8 years. The current one is 8.4 years old and is approaching the longest of 9.4 years in the 1990s. Clients, managers and allocators tend to forget about risk when they are making money. I always think about risk because I have seen a lot of those 16 bull markets. I remember quite well 1987 when the market corrected 30% in two weeks. That changed a lot of plans for a lot of people. Are you evaluating risk in 2018?