Category: Market Research Page 1 of 12

A New Normal?

Sticky post

What is normal? 

It seems like the markets are always moving from one crisis to the next and trying to define the “new normal”.  Perhaps we can blame the media for promoting drama in attempts to attract viewers.  That may occasionally be true but no doubt that legitimate societal stresses are commonplace: wars, high profile corporate or even municipal bankruptcies, terrorist attacks, and natural disasters are just a few reoccurring events or conditions.  AND YET…markets have historically rallied back to eventually make new highs.

There are numerous examples on the internet of historical charts showing notable world events and the market’s reaction in price and duration. 

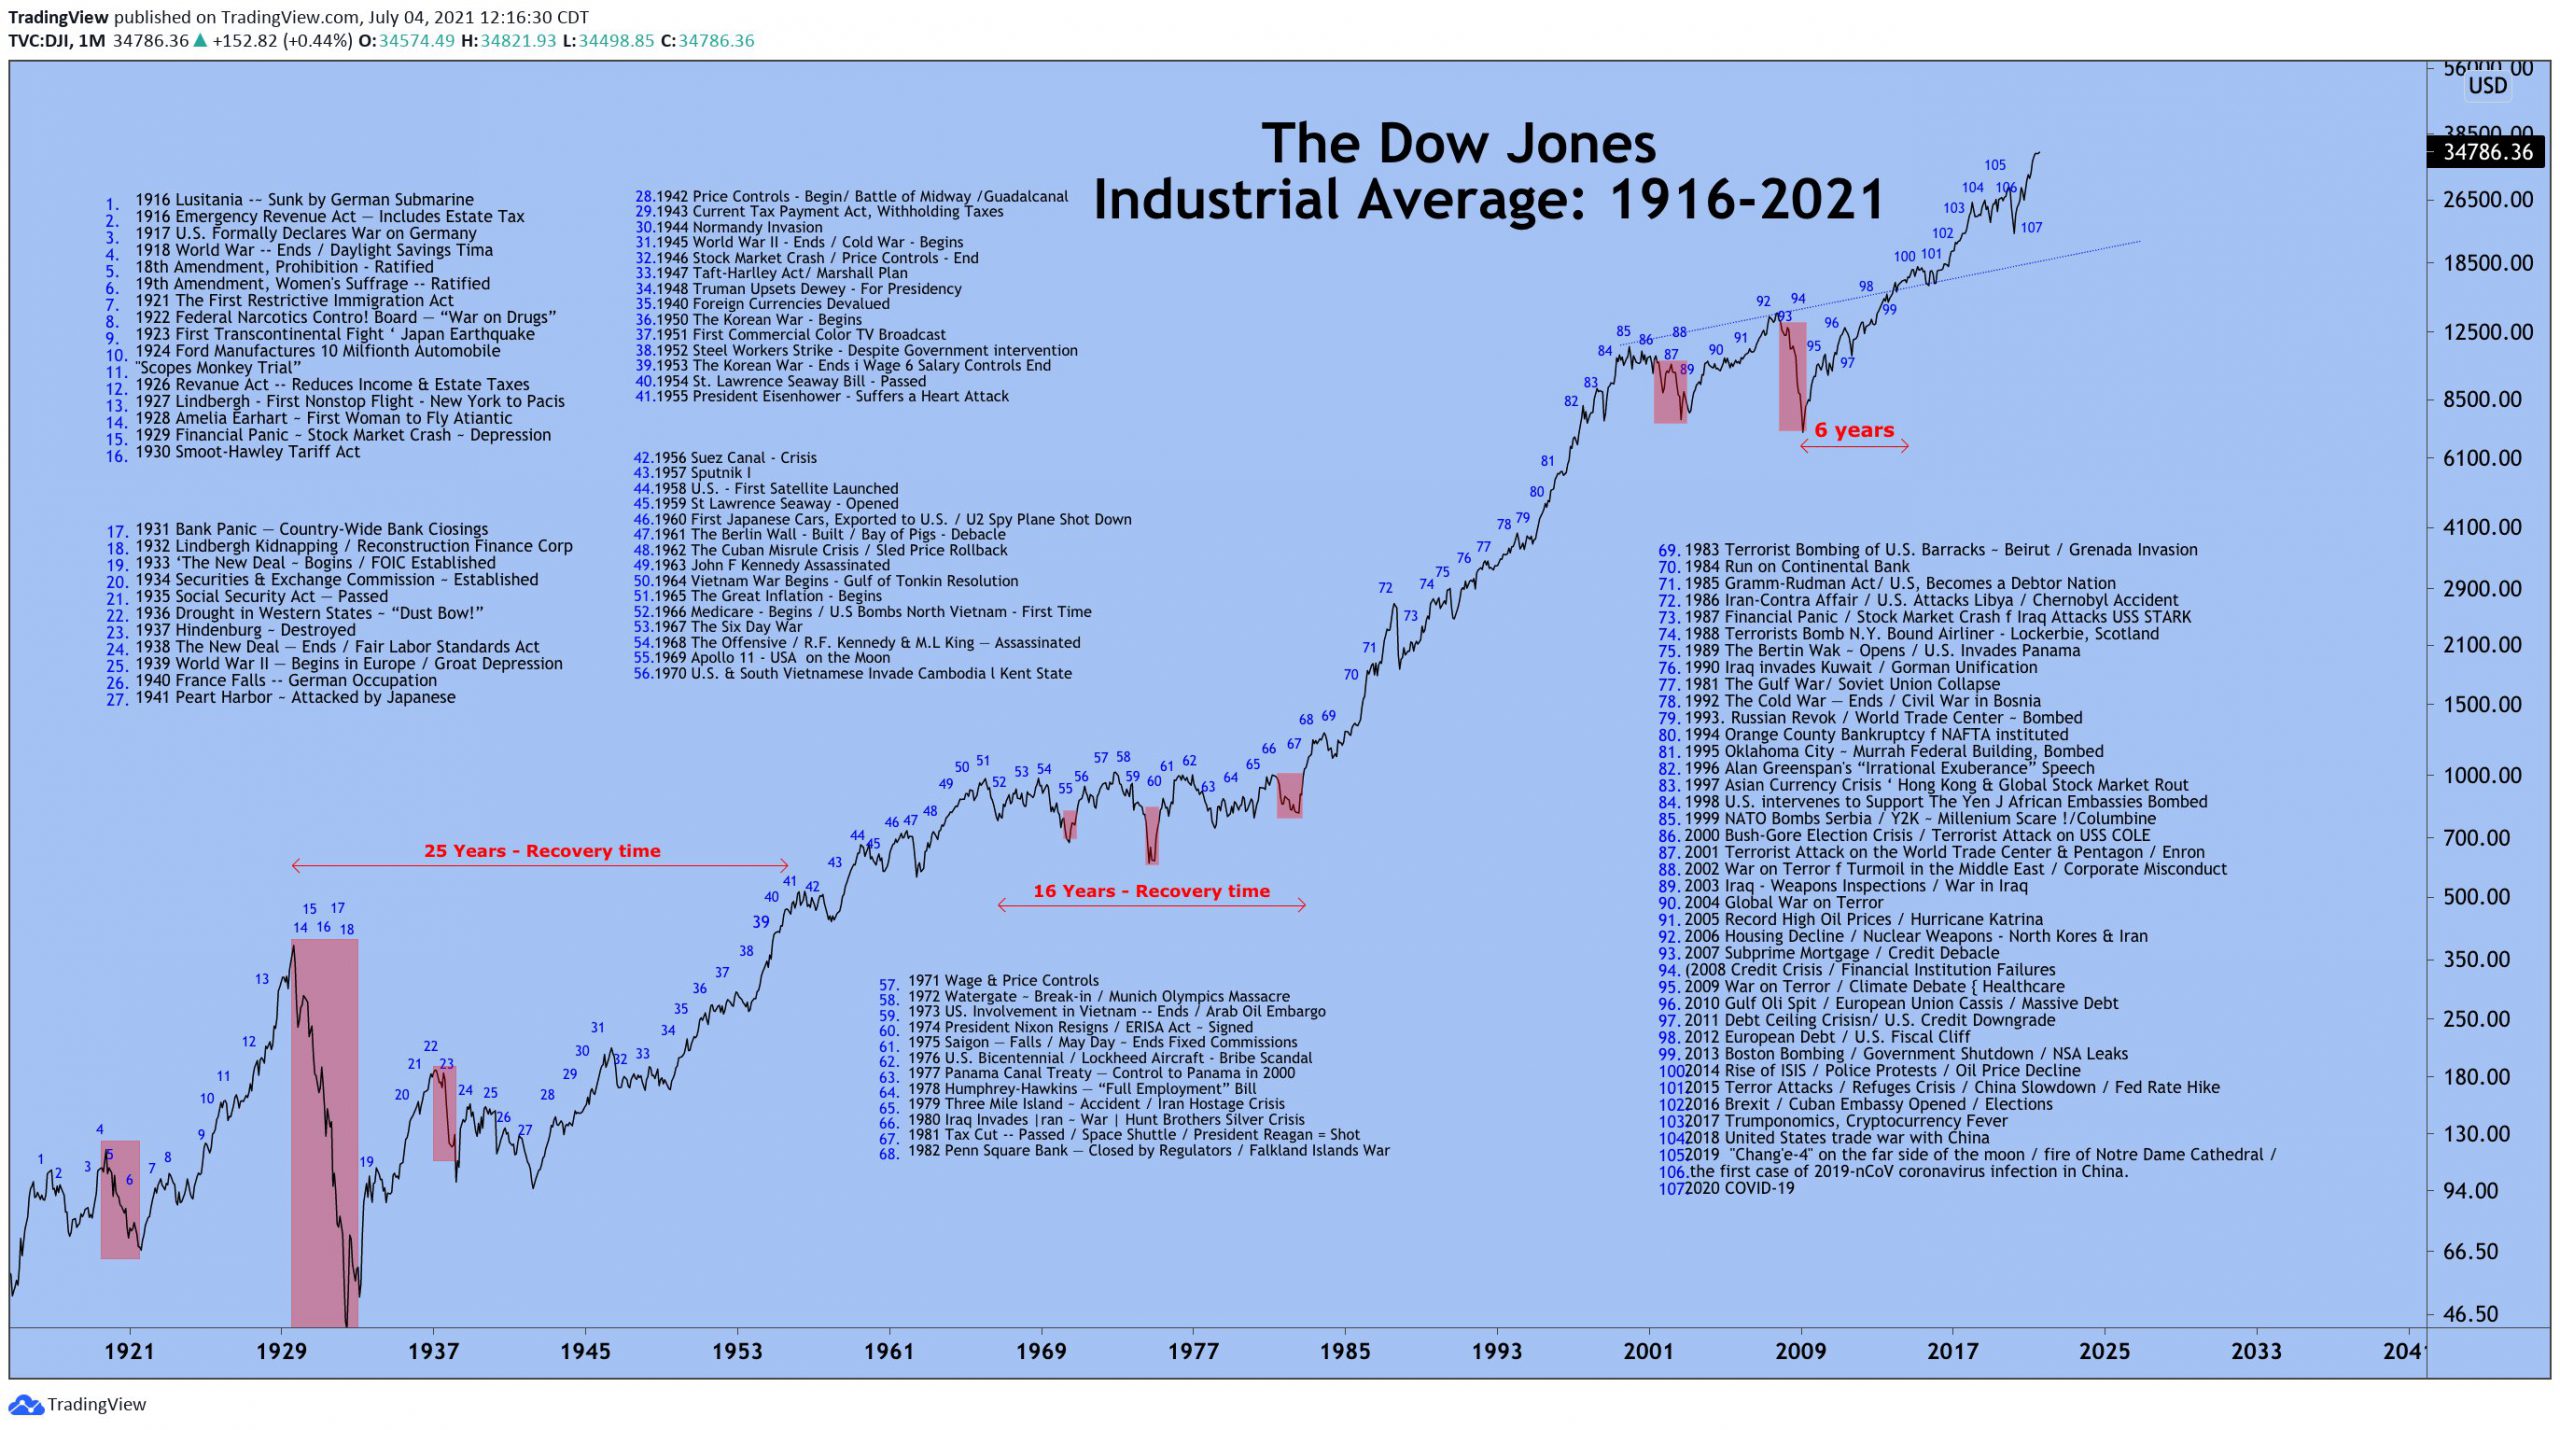
TradingView is the source of this chart, originally published 7/4/21 and is one of the more extensive compilations I have seen.

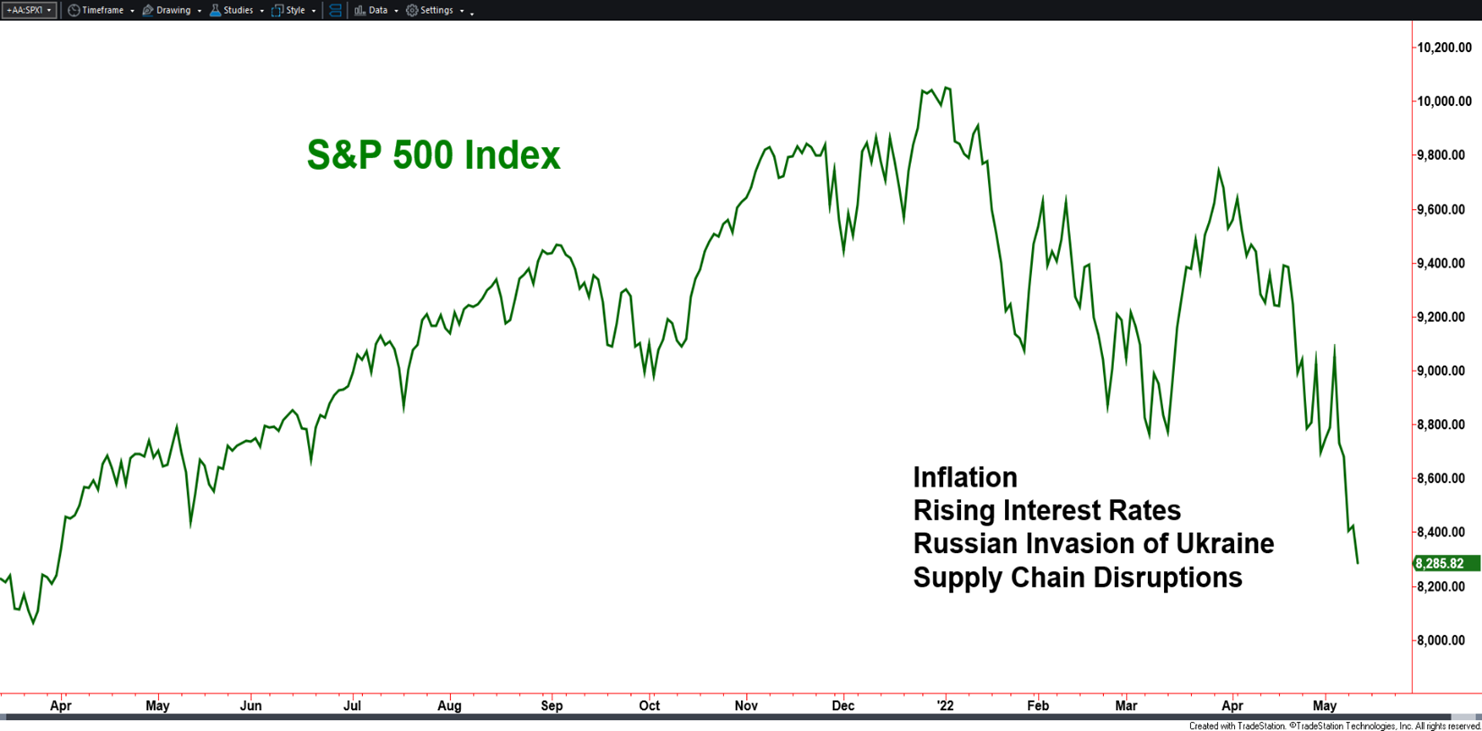
Updating for recent price action (but using the S&P 500 Index), note the significant influences to the recent decline in the chart below.

Created with TradeStation. © TradeStation Technologies, Inc. All rights reserved

The objective or bottom line of most articles, blogs, news stories, charts, etcetera that tie negative news to the stock market tends to be a message that investors should be calm and have hope, with a focus on a brighter future.  That advice has been correct for 100% of all pullbacks, corrections and bear markets since stocks began trading under the Buttonwood tree in lower Manhattan, and up through early January of this year.  That advice may be oversimplistic as the devil may be in the details.

The Fluidity of Indexes

Historical charts of indexes should be viewed with a grain of salt in that indexes periodically change components and weightings.  For example:

  • The Dow Jones Industrial Average has removed/added members 57 times since 1896.
  • The S&P 500 Index is rebalanced on a quarterly basis.

A committee establishes criteria and companies are added and subtracted.  This is a common practice for indexes.  Therefore, index charts most often are strung together performances of individual stock constituents held at that time.  The all-time highs made in early January by the S&P 500 Index and the Dow Jones Industrial Average were not set by the same stocks within the indexes during the bear market of 2008.  Investors that were holders in those particular stocks during the 2008 bear could have been given hope that the indexes should come back eventually.  Well – the indexes did but perhaps not with the down and out names held by some investors.  Is that idea a pitch for indexing, as in, should investors focus on just owning index investments?  No, not necessarily. There is a difference, however, between blind faith in a generalized market recovery in futures versus what companies may participate or be left out.

Let’s shift focus to why.

Again, through January of this year, all negative market periods over the last 100+ years have “recovered”.  This view is based on understanding and embracing the foundational economic principle that supports capitalism or at least market driven economies – profit motive.  Companies are often started by determined individuals, betting on themselves, looking to enrich their lives which often aligns with the betterment of other lives as well.  A lack of product demand and/or a lack of profit will eventually lead to a company’s failure.  In the context of this discussion, investors can choose to be a part of a company’s success or failure through stock ownership.  There is an individual and corporate drive to succeed in a free market system. 

Success is often determined on how a company responds to challenges and crisis.  New challenges come with each crisis.  New solutions are found and assumed to be rewarded.  At the onset of the pandemic, the equity markets fell sharply as questions were brought up regarding how the economy would be affected.  Generally speaking, the market then moved higher as answers came to light.  Again, some companies have not come back but many have and have done so transformed as evolved versions of themselves.        

Now that we have covered topics of optimism, warning, and back to optimism, let’s return to warning. 

The duration and depth of crisis have never been consistent.  Exhibiting faith in an eventual recovery is one thing, but it should not be blind faith as the pain of the crisis is endured.  Active management of investments, adjusting portfolios to changes in risk is not in opposition to the idea of market recovery.  The two can be symbiotic.    

As investors, we should not be expecting the market to settle into a “new normal”.  It will never come if defined as an extended period of a “lack of concerns”.  We must accept that “normal” is a constant pursuit of new innovations and ideas and we can participate by way of the markets while dodging and parrying the dangers.

At Spectrum Financial, we continue to pursue risk adjusted opportunities that the market presents and manage life altering risk for our clients. 

Factor Investing

Sticky post

The stock market is often referred to as a single entity but is made up of many moving parts.  Looking beneath the surface at single and multi-factor indexes can help investors better understand trends that may not be as visible when looking at the major indexes.

Factor investing has been around for many years but has only become more mainstream recently as investors have been given easier access to more specialized investments.  This area has been evolving with the growing popularity of “multi-factor” investments.  First, let’s begin with defining single factor investments and then progress onto more complex multi factor methods.

Single Factor

People tend to gravitate toward organization and categorizing information in order to better understand attributes and possible outcomes.  As an example, consider this analogy between factor investing and cars. Cars with big V-8 engines tend to be fast and powerful while those with small four cylinders tend to be more fuel efficient and less performance oriented.  Such a conclusion may not always be the case but is a tendency.  Engine size is simply one “factor” when assessing an automobile.  Investors do this with stocks too.  The most widely recognized indexes are one factor, or “single factor”.  A single factor may also be characterized by a sector such as a semiconductor index or a gold stock index.

The S&P 500 Index may be diversified but it is simply the 500 largest companies.  This makes size or market capitalization the single factor.  Along the same lines, the Russell 2000 Index is a small-cap index.  In the chart below, there was a clear distinction between the performance of large caps versus small-caps during mid-2018 as small-caps led the way higher.  In 2019, large-cap stocks have been displaying overall leadership.  This illustrates how factors can help explain what has been driving returns, giving a deeper perspective than over generalizing movements in the stock market.  Investment choices have become more easily available to investors that attempt to give exposure to those factors.

Multi-Factor

Multi-factor investments are the natural progression after single factor ones.  Common multi-factors include value and growth.  At first glance, these individually may sound like single factors but to determine value or growth, many factors are combined.  For example, an index provider putting together a value or a growth index may use price-to-earnings ratios, price-to-book, or dividend yield among other criteria.  These are most often well-defined, quantifiable filters to find stocks to be included in the index.

If some of the factors already covered are combined, the stock market can be broken down to an even more granular level often called “style investing”.  Each size, small, mid, and large cap is then further separated into growth or value.  In the chart below large-cap value is being compared to small-cap growth.  During the first three quarters of 2018, value stocks were rather subdued while small-cap growth was rewarded.

Factor investing has adopted very specific characteristics beyond the historically common size or styles.  Categorizing stocks down to attributes can yield an interesting perspective.  Some examples are high and low volatility, value, momentum, and quality.  These tend to be multi-factor as it can take a combination of numerous filters to find stocks with the targeted characteristic.

A momentum factor index or investment may use the performance return of multiple time frames and may be absolute returns, or the stocks return, relative to a benchmark. Some index companies define momentum as positive earnings momentum (growth factor). Quality factor investments may include formulas that filter for companies with low debt, stable earnings growth, and measures of profitability.  The recipe for making a multi-factor index it generally transparent and can be found in documentation released by the indexing company.

Having factor-based investment choices allows investors to be positioned to possibly take advantage of various economic or technical conditions.

  • Quality and lower volatility factors may take on defensive characteristics during times of stress in the markets.
  • Momentum and higher beta factors may take advantage of bull market rallies when higher risk is being rewarded.

Active portfolio managers may use rotation methods, moving between various factor investments as conditions change.  In the chart below, the black lined Relative Strength, displays the performance of the high beta factor to the low volatility factor.  A rising black line conveys leadership by the high beta index and a falling line shows leadership period by the lower volatility index.  Technical analysis methods can be applied to the Relative Strength line in order to better define the trend of leadership and its transitions.

Uncovering the idiosyncrasies of the stock and bond market in order to invest strategically has always been an obsessive compassion of the portfolio management team at Spectrum Financial. The team uses several disciplines and factors when constructing portfolios and making investment decisions for its clients.

Page 1 of 12

Spectrum Financial, Inc 2023