Several weeks ago, we began to dismantle the argument commonly perpetuated by the media that if the Federal Reserve begins a tightening interest rate cycle, the “bond market” could have headwinds and possibly shift into a bear market. Our comments were not focused on debating the future direction of the bond market but to encourage investors to see the bond market not as a singular entity, but having categories and sub-groups. Each can have enough distinctive characteristics that serve as the foundation of bond rotation concepts and strategies.
Previously, we covered some broad topics, followed by zooming in on one practical aspect in regards to rotation. We will do that again but zoom in on a different key characteristic.
Various bond categories exist and within each, trading characteristics of individual category and sub-group can change based on rating quality and shorter or longer maturity.
Correlation and beta are two statistics deserving a deeper dive. Afterward, we can back away from some of the technical geek-speak and look at practical uses of the concepts. The chart below displays 3-year, monthly-based correlation and beta figures obtained from Bloomberg.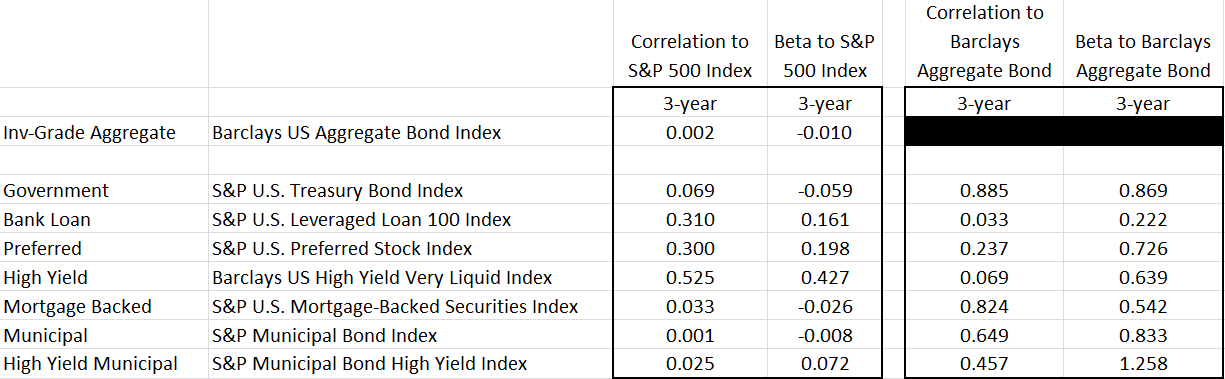
Generally speaking, correlation tells us how often two entities move in the same direction. It does not measure the intensity of the movements, rather, if they move in the same direction. Settings can be adjusted, but comparison of monthly direction is commonly displayed over multiple time frames (3-year, 5-year, 10-year, etc) but only 3-year is displayed above. Correlation is also referred to as R-squared by statisticians and is often labeled as such in financial reports. The numbers are most often reported as decimals but tend to make more sense if converted into percent. For example, in the table above, the Bank Loan correlation to the S&P 500 Index is 0.310, meaning over the last three years, 31% of the months in which the S&P was up, the S&P U.S. Leveraged Loan 100 Index was up too. Correlations are often displayed compared to broad market indexes such as the S&P 500 Index as well as benchmarks more closely related to the specific group being assessed. The table below displays categories within the bond market and on the right side, displays correlations to the Barclays Aggregate Bond Index. That index is a common comparison to bond groups because the “AGG” as it is commonly called, is an index designed to display a mix of all the investment-grade bond classes (below investment grade high yield is excluded).
Correlations to the S&P 500 Index are commonly displayed because most investors are familiar with the index and its “personality” which makes it a useful baseline for assessment. Correlations can change over time but the general tendencies are used by investors as rules-of-thumb. Notice how the various bond categories have correlations to the S&P 500 Index that are quite different from each other. That is an important characteristic. The table below has been sorted to help bring out those differences.
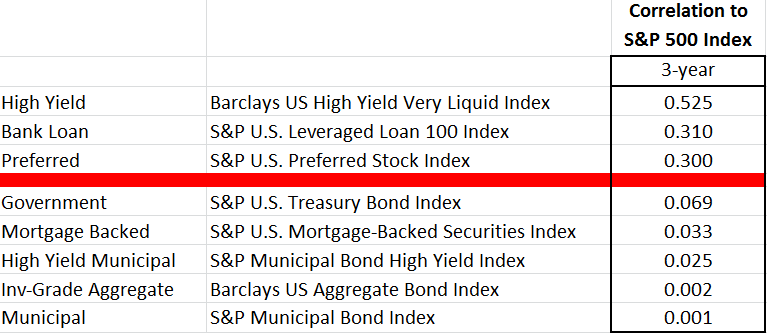 Correlations of the top three (high yield, bank loan, and preferred) may not seem extremely high but are significantly higher than the other bond groups. The primary reason behind higher correlations of the high yield, bank loan, and preferred categories to the S&P 500 Index is because the ability of the underlying payers of the obligation tend to have greater sensitivity to economic conditions. If the economy is growing, bank loans tend to get paid, companies that tap into financing through the high yield market have an easier time to make their debt payments, and companies with preferred stock have less odds of cutting dividend amounts. These growth economy bond classes tend to be more attractive when investors are seeking higher risk in order to potentially gain higher return. These categories, relative to the next group discussed, are commonly referred to as “Risk-On” bond categories.
Government, mortgage backed, investment grade and high yield municipal bonds, and general investment grade corporate bonds have less sensitivity to the economy for various reasons. If the economy is in a recession or contraction phase, the government has taxing authority which reduces risk of missing bond interest payments. Most municipalities also have taxing authority. Mortgage payers may have some stress making payments during tougher economic times but generally speaking, one’s mortgage is a high priority and thus, lower risk to the mortgage holder/investors. Investment grade is a larger category which includes subgroups of each category (investment grade municipals, governments, mortgage backed). Keep in mind the “investment grade” is an opinion from independent rating agencies regarding the ability to pay even under weaker economic conditions. These categories, therefore, as often referred to as “Risk-Off” bond categories.
At the risk of oversimplifying it, beta measures the intensity of the movement by the index (stock, etc) being assessed versus another index. Based on the 3-year period in this case, beta refers to the typical percentage participation of a 1% change in the target index. For example, the S&P U.S. Leveraged Loan 100 Index would typically move higher by 0.16% if the S&P 500 Index were to be up 1.00%. (see chart below)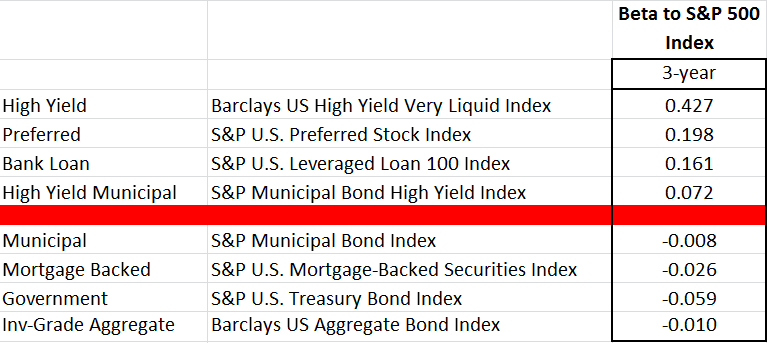 It is important to realize correlations and betas not only evolve over time but can be different in a rising market environment versus a falling market environment. Also, betas can be misleading if the index has been extended to the upside or downside and a mean reversion snap-back takes place. Indexes that have low beta readings can become uncharacteristically volatile well beyond the noted beta metric. The point is not to rely too heavily on correlations and betas in a legalistic manner by assuming strict adherence to the implications of the metrics. Correlations and betas are simply rules-of-thumb when learning about the tendencies of the indexes. The chart below displays the major bond categories for the trailing twelve months.
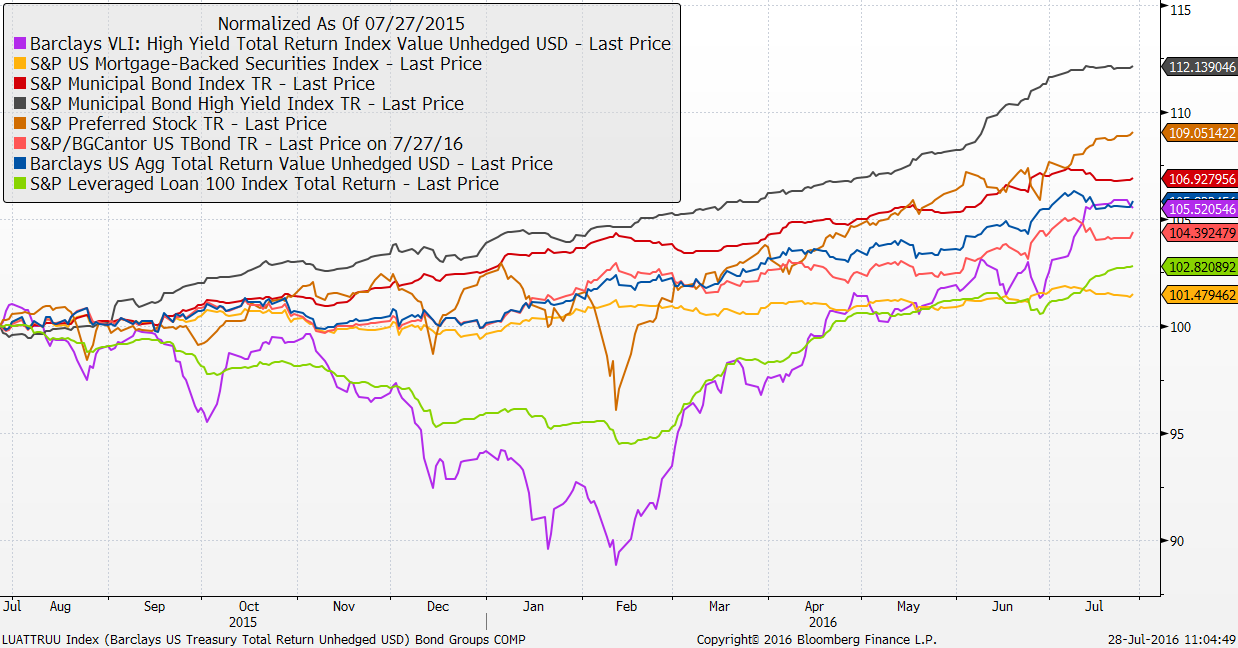
From July 2015 through January 2016, the “Risk-On” bond categories of the high yield (corporate), leveraged loan, and preferred, each suffered but did so with differing volatilities. The “Risk-Off” categories worked higher and also with differing volatilities. That time period is more representative of common characteristics. Since February of this year, however, “Risk-On “ and “Risk-Off” have both trended higher for various fundamental reasons. We can’t say with certainty but odds favor a return to the rule-of-thumb characteristics of at some point, the “Risk-On” and “Risk-Off” categories with begin to trend in opposite directions but with differing volatilities within the categories.
“Risk-On/Risk-Off” analysis of the bond market can be an efficient way to narrow investment choices.
Investors that lean heavily on economic or fundamental analysis may possibly conclude a growth phase is just around the corner. In that case, further analysis focused on the “Risk-On” categories would be in order. Practitioners of technical analysis could use various forms of relative strength models on the two paths of bond risks in a top-down path within bond rotation. A foundational step to greater understanding of the bond market is to first recognize individual categories have “personalities”. Further separation of characteristics is possible with risk-on/off assessment. As those characteristics become learned, investors should be able to better match specific bond investments to investment objectives within portfolios.
Disclosures
S&P 500 TR Index: is a capitalization weighted index of 500 stocks representing all major domestic industry groups and assumes the reinvestment of dividends and capital gains. It is not possible to directly invest in any index.
Barclays US High Yield Very Liquid Index: This benchmark includes publicly issued U.S. dollar denominated non-investment grade, fixed-rate taxable corporate bonds that have a remaining maturity of at least one year, regardless of optionality. The bonds are rated high yield (Ba1/BB+/BB+ or below) using the middle rating of Moody’s, S&P, and Fitch, respectively (before July 1, 2005, the lower of Moody’s and S&P was used). Included issues consist of only the three largest bonds from each issuer that has a minimum amount outstanding of $500 million or more (face value) and less than five years from issue date.
S&P/LSTA U.S. Leveraged Loan 100 Index: This benchmark is designed to reflect the performance of the largest facilities in the U.S. dollar leveraged loan market. Term loans from syndicated credits must meet the following criteria at issuance to be eligible for inclusion. 1) senior secured 2) minimum initial term of one year 3) minimum initial spread of LIBOR +125 basis points 4) U.S. dollar denominated 5) all constituents must have a publicly assigned CUSIP
Barclays U.S. AGG: Bond Index: The Barclays U.S. Aggregate Bond Index measures performance of the total U.S. investment grade bond market. It is a market value-weighted index that tracks the daily price, coupon, pay-downs, and total return performance of fixed-rate, publicly placed, dollar-denominated, and non-convertible investment grade debt issues with at least $250 million par amount outstanding and with at least one year to final maturity.
SPMBST: The S&P U.S. Mortgage-Backed Securities Index is a rules-based, market-value-weighted index covering U.S. dollar-denominated, fixed-rate and adjustable-rate/hybrid mortgage pass-through securities issued by Ginnie Mae (GNMA), Fannie Mae (FNMA) and Freddie Mac (FHLMC).
SAPIMAIN: The S&P U.S. Municipal Bond Index is a broad, market value-weighted index that seeks to measure the performance of the U.S. municipal bond market.
SAPIHY: The S&P U.S. Municipal Bond High Yield Index consists of bonds in the S&P Municipal Bond Index that are not rated or are rated below investment grade.
SPTREFTR: The S&P U.S. Preferred Stock Index is designed to measure the performance of the U.S. preferred stock market. Preferred stocks pay dividends at a specified rate and receive preference over common stocks in terms of dividend payments and liquidation of assets.
SPBDUSBT: The S&P U.S. Treasury Bond Index is a broad, comprehensive, market-value weighted index that seeks to measure the performance of the U.S. Treasury Bond market.
This writing is for informational purposes only and does not constitute an offer to sell, a solicitation to buy, or a recommendation regarding any securities transaction, or as an offer to provide advisory or other services by Spectrum Financial, Inc. in any jurisdiction in which such offer, solicitation, purchase or sale would be unlawful under the securities laws of such jurisdiction. The information contained in this writing should not be construed as financial or investment advice on any subject matter. Spectrum Financial, Inc. expressly disclaims all liability in respect to actions taken based on any or all of the information on this writing. For full disclosure please see disclosures page here.
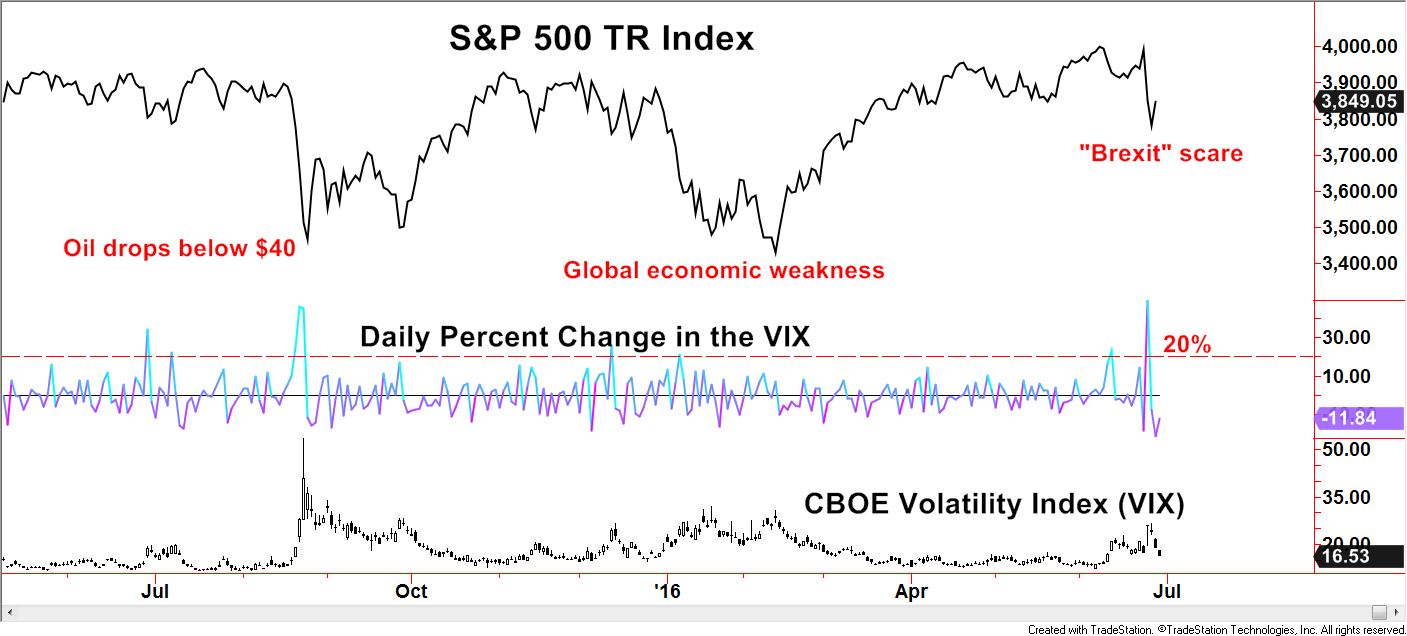
 Created with TradeStation © TradeStation Technologies, Inc. All rights reserved