
Spectrum Advisors Preferred Fund (SAPEX) was launched three years ago and has acquired a 5-Star Morningstar Rating Overall and 5-Star Morningstar Rating for 3 years in its fund category, Multi Alternative, made up of 288 funds. (Morningstar disclosure below) This Fund was created for investors who want equity exposure in a fund that can also reduce risk. The goal of the fund is to outperform the equity market in both up and down markets. The research and portfolio construction of SAPEX has allowed this fund to receive its high rating and perform according to its objectives. Spectrum’s research found that understanding the equity market environment is important. The stock market has different personalities in different economic environments. Depending on the market environment, Bear, Bull or Transitional, the Fund will use different “play books”. These market environment types are defined by Spectrum’s investment and research team and are not the common media definitions. The play books have different analysis tools, asset types, speed of trades, and exposure ranges that allow the Fund to be dynamic and adaptive in changing environments.
![]()
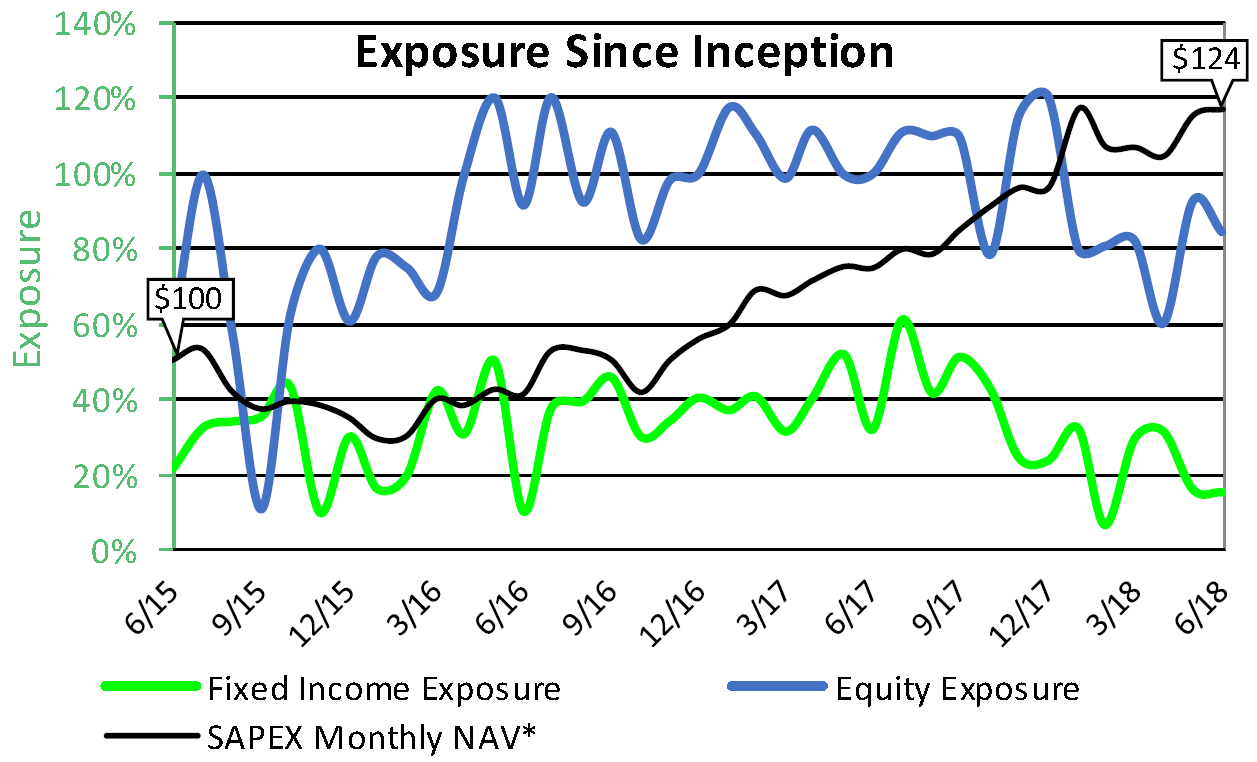
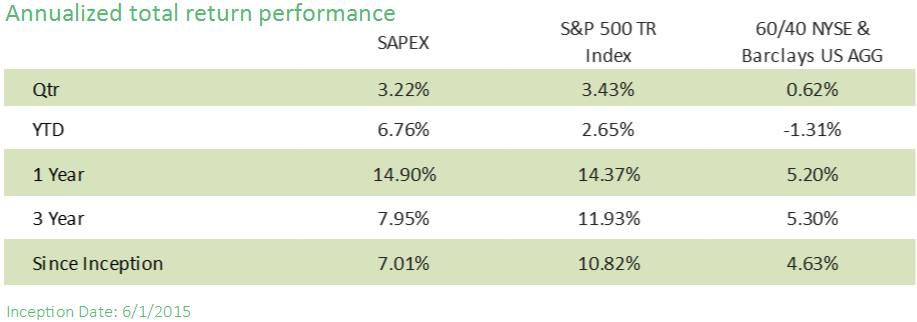
The chart above illustrates the Fund’s exposure to both stocks and bonds since inception. It had an “up market capture” of 103% and a “down market capture” of 81.5% of its blended stock-bond benchmark. For the first 6 months of 2018, SAPEX had a gain of 6.76% and outperformed the S&P 500 TR Index by 4.11% and outperformed the NYSE Composite TR Index by 7.83%. (See full performance information and disclosures below)
By combining all these strategies into an overall portfolio, the investment team strives to do four things based on the market environment: (1) Select the best stock pickers. (2) Determine how much and what kind of equity exposure to have. (3) Implement bear market strategies to reduce risk in economic recessions. (4) Specific selection of bond and credit investments may be used to add additional return when appropriate. To learn more about SAPEX, please call our office at 757-463-7600 or visit TheSpectrumFunds.com.
 The performance data quoted represents past performance. Past performance does not guarantee future results. Investment return and principal value will fluctuate, so that shares, when redeemed, may by worth more or less than their original cost. Current performance may be lower or higher than the performance data quoted and assumes the reimbursement of any dividend and/or capital gains distributions. To obtain performance data current to most recent month-end, please call toll free 1-888-572-8868.
Consider these risks before investing: Bond risk, derivatives risk, equity risk, inverse ETF risk, junk bond risk, leverage risk,
management risk, market risk, mutual fund and ETF risk, short position risk, small and medium capitalization risk, and turnover risk. There is no guarantee the fund will achieve its investment objective. You can lose money by investing in the fund. Please carefully review the prospectus for detailed information about these risks.
S&P TR 500 Index is a capitalization weighted index of 500 stocks representing all major domestic industry groups. The S&P 500 TR assumes the reinvestment of dividends and capital gains. It is not possible to directly invest in any index.
*60/40 NYSE Composite/Barclays U.S. AGG. Bond Index: This benchmark gives 60% weight to the NYSE Composite Index and 40% weight to the Barclays U.S. Agg. Bond Index. The NYSE Composite Index (NYA) measures the performance of all stocks listed on the New York Stock Exchange. It includes more than 1,900 stocks, of which over 1,500 are U.S. companies. Its breadth therefore makes it a much better indicator of market performance than narrow indexes that have far fewer components. The weights of the index constituents are calculated on the basis of their free-float market capitalization. The index itself is calculated on the basis of price return and total return, which includes dividends. The Barclays U.S. Aggregate
Bond Index measures the underlying index and performance of the total U.S. investment grade bond market. It is a market value-weighted index that tracks the daily price, coupon, pay-downs, and total return performance of fixed-rate, publicly placed, dollar-denominated, and non-convertible investment grade debt issues with at least $250 million per amount outstanding and with at least one year to final maturity.
Request a prospectus or a summary prospectus from your financial representative or by calling Gemini Fund Services at 855-582-8006 or access www.thespectrumfunds.com. These prospectuses include investment objectives, risks, fees, expenses, and other information that you should read and consider carefully before investing. Gemini Fund Services serves as transfer agent to the Fund and is not affiliated with the advisor, subadvisor or distributor.
*© 2018 Morningstar, Inc. All Rights Reserved. The information contained herein: (1) is proprietary to Morningstar; (2) may not be copied or distributed; and (3) is not warranted to be accurate, complete or timely. Neither Morningstar nor its content providers are responsible for any damages or losses arising from any use of this information. Past performance is no guarantee of future results. The Morningstar Rating TM for funds, or “star rating”, is calculated for managed products (including mutual funds, variable annuity and variable life subaccounts, exchange-traded funds, closed-end funds, and separate accounts) with at least a three-year history. Exchange-traded funds and open-ended mutual funds are considered a single population for comparative purposes. It is calculated based on a Morningstar Risk-Adjusted Return measure that accounts for variation in a managed product’s monthly excess performance, placing more emphasis on downward variations and rewarding consistent performance. The top 10% of products in each product category receive 5 stars, the next 22.5% receive 4 stars, the next 35% receive 3 stars, the next 22.5% receive 2 stars and the bottom 10% receive 1 star. The Overall Morningstar Rating for a managed product is derived from a weighted average of the performance figures associated with its three-, five- and ten-year (if applicable) Morningstar Rating metrics. The weights are: 100% three-year rating for 36-59 months of total returns, 60% five-year rating/40% three-year rating for 60-119 months of total returns, and 50% 10-year rating/30% five-year rating/20% three-year rating for 120 or more months of total returns. While the 10-year overall star rating formula seems to give the most weight to the 10-year period, the most recent three-year period actually has the greatest impact because it is included in all three rating periods.
The performance data quoted represents past performance. Past performance does not guarantee future results. Investment return and principal value will fluctuate, so that shares, when redeemed, may by worth more or less than their original cost. Current performance may be lower or higher than the performance data quoted and assumes the reimbursement of any dividend and/or capital gains distributions. To obtain performance data current to most recent month-end, please call toll free 1-888-572-8868.

Consider these risks before investing: Bond risk, derivatives risk, equity risk, inverse ETF risk, junk bond risk, leverage risk,
management risk, market risk, mutual fund and ETF risk, short position risk, small and medium capitalization risk, and turnover risk. There is no guarantee the fund will achieve its investment objective. You can lose money by investing in the fund. Please carefully review the prospectus for detailed information about these risks.

S&P TR 500 Index is a capitalization weighted index of 500 stocks representing all major domestic industry groups. The S&P 500 TR assumes the reinvestment of dividends and capital gains. It is not possible to directly invest in any index.

*60/40 NYSE Composite/Barclays U.S. AGG. Bond Index: This benchmark gives 60% weight to the NYSE Composite Index and 40% weight to the Barclays U.S. Agg. Bond Index. The NYSE Composite Index (NYA) measures the performance of all stocks listed on the New York Stock Exchange. It includes more than 1,900 stocks, of which over 1,500 are U.S. companies. Its breadth therefore makes it a much better indicator of market performance than narrow indexes that have far fewer components. The weights of the index constituents are calculated on the basis of their free-float market capitalization. The index itself is calculated on the basis of price return and total return, which includes dividends. The Barclays U.S. Aggregate
Bond Index measures the underlying index and performance of the total U.S. investment grade bond market. It is a market value-weighted index that tracks the daily price, coupon, pay-downs, and total return performance of fixed-rate, publicly placed, dollar-denominated, and non-convertible investment grade debt issues with at least $250 million per amount outstanding and with at least one year to final maturity.

Request a prospectus or a summary prospectus from your financial representative or by calling Gemini Fund Services at 855-582-8006 or access www.thespectrumfunds.com. These prospectuses include investment objectives, risks, fees, expenses, and other information that you should read and consider carefully before investing. Gemini Fund Services serves as transfer agent to the Fund and is not affiliated with the advisor, subadvisor or distributor.

*© 2018 Morningstar, Inc. All Rights Reserved. The information contained herein: (1) is proprietary to Morningstar; (2) may not be copied or distributed; and (3) is not warranted to be accurate, complete or timely. Neither Morningstar nor its content providers are responsible for any damages or losses arising from any use of this information. Past performance is no guarantee of future results. The Morningstar Rating TM for funds, or “star rating”, is calculated for managed products (including mutual funds, variable annuity and variable life subaccounts, exchange-traded funds, closed-end funds, and separate accounts) with at least a three-year history. Exchange-traded funds and open-ended mutual funds are considered a single population for comparative purposes. It is calculated based on a Morningstar Risk-Adjusted Return measure that accounts for variation in a managed product’s monthly excess performance, placing more emphasis on downward variations and rewarding consistent performance. The top 10% of products in each product category receive 5 stars, the next 22.5% receive 4 stars, the next 35% receive 3 stars, the next 22.5% receive 2 stars and the bottom 10% receive 1 star. The Overall Morningstar Rating for a managed product is derived from a weighted average of the performance figures associated with its three-, five- and ten-year (if applicable) Morningstar Rating metrics. The weights are: 100% three-year rating for 36-59 months of total returns, 60% five-year rating/40% three-year rating for 60-119 months of total returns, and 50% 10-year rating/30% five-year rating/20% three-year rating for 120 or more months of total returns. While the 10-year overall star rating formula seems to give the most weight to the 10-year period, the most recent three-year period actually has the greatest impact because it is included in all three rating periods.
