
March began with a bang, as markets rushed to new highs, invigorated by the speech President Trump gave to Congress. The highs were short-lived, however, as the market slowly bled off the positive returns throughout the remainder of the month. Even the Federal Reserve raising rates for the third time did little to rally investors, as concern over the likelihood of the Trump agenda coming to fruition mounted. News aside, economic metrics remain strong and consumer confidence continues to be high. Despite media driven frenzies, market volatility remains stable at a relatively low level, and foreign markets are performing well. Moving forward investors continue to eye fiscal policy implementation and Federal Reserve rhetoric for signs of deviation from expectations.
 Created with TradeStation. © TradeStation Technologies, Inc. All rights reserved.
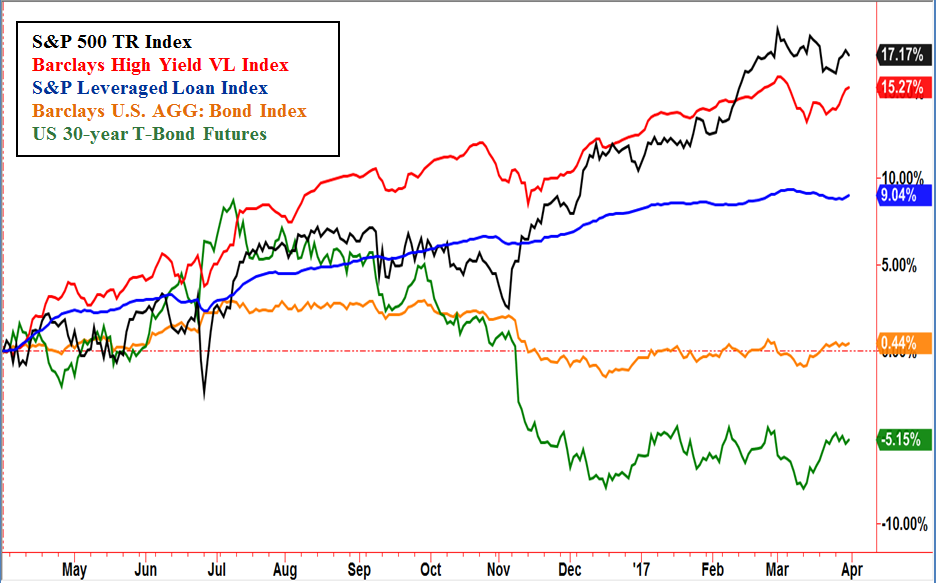
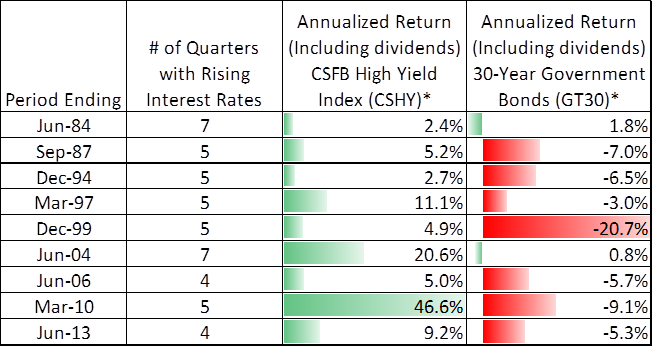
Ongoing improvements in economic data continue to be supportive of equities and some fixed income classes, primarily the high yield and bank loan/floating rate areas. Trends wobbled but were not broken, perhaps as investors favored the underlying growth prospects over the volatile political headlines. President Trump’s pro-growth agenda continued to provide a helpful backdrop to investors looking to tag reasons to the rallies in growth sectors. A stronger economy often benefits some bond sectors such as high yield bonds, as companies have reduced odds of defaulting on interest payments. Economic strength also tends to be supportive of leveraged loans. Leveraged loans are mostly comprised of bank loan products, a segment that tends to rise in step when interest rates increase. Risk-averse areas such as higher-rated bonds, corporate bonds, and government bonds, were shaky in March but overall have been building trading ranges for all of the first quarter of 2017. This is an improvement over the declines seen in the previous quarter. Despite shorter-term improvements, major trends in the quality bond areas are still generally weak, as inflationary forces tend to erode the attractiveness of these fixed income investments.
 Created with TradeStation. © TradeStation Technologies, Inc. All rights reserved.
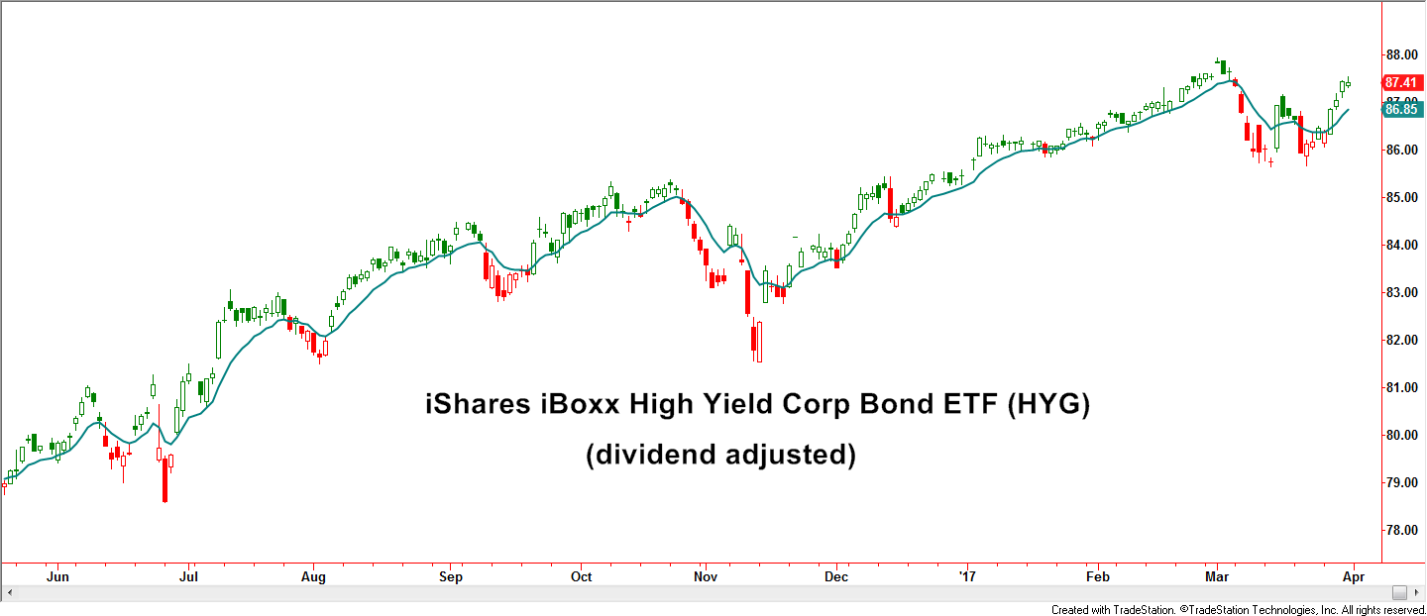
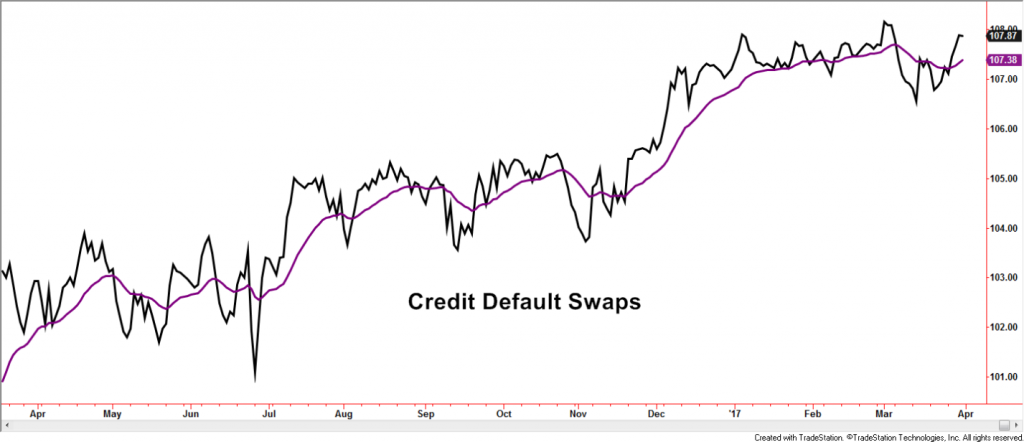
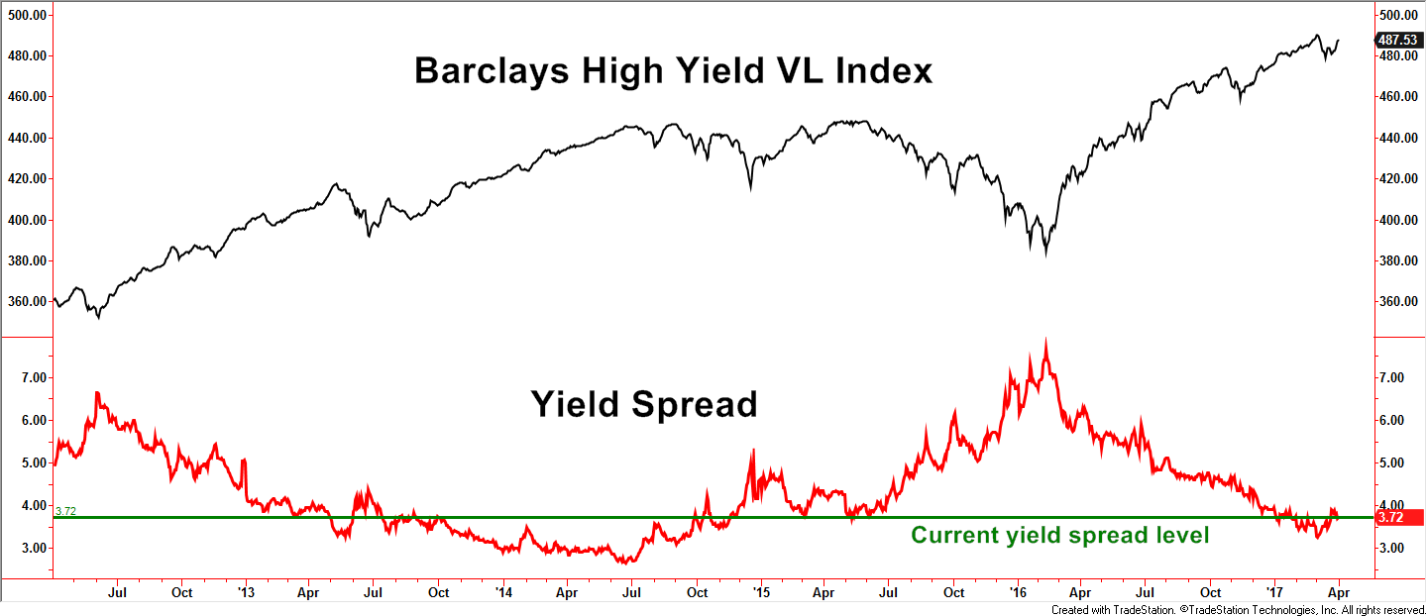
The charts above represent several categories within the high yield market. By looking at multiple categories, information regarding risk can be assessed which plays a role within Spectrum strategies.
Products such as the iShares iBOXX High Yield Bond ETF (HYG) and Credit Default Swaps tend to be more sensitive to changes in investor sentiment. Volatility and trends are monitored to assess the odds of a continued bullish outcome. The yield spread is another measure of investment risk. Generally speaking, it measures the difference in yield between treasury bonds and high yield bonds. Spreads widen when investor fear is heightened, sometimes for valid, longer-term reasons, and sometimes for short-lived, more emotional reasons. A favorable environment is characterized by declining yield spreads. This was the case for 2016 and so far in 2017. Yield spreads have still not reached the lows seen in the last cycle but the proximity could soon begin to affect demand for high yield instruments.
Our strategies have various requirements before taking positions. The Dynamic High Yield Strategy often takes advantage of the more short-term opportunities while the High Yield Strategy generally waits for lower volatility and more discernible positive trends. The Leveraged High Yield Strategy incorporates elements of both.
 Created with TradeStation. © TradeStation Technologies, Inc. All rights reserved.
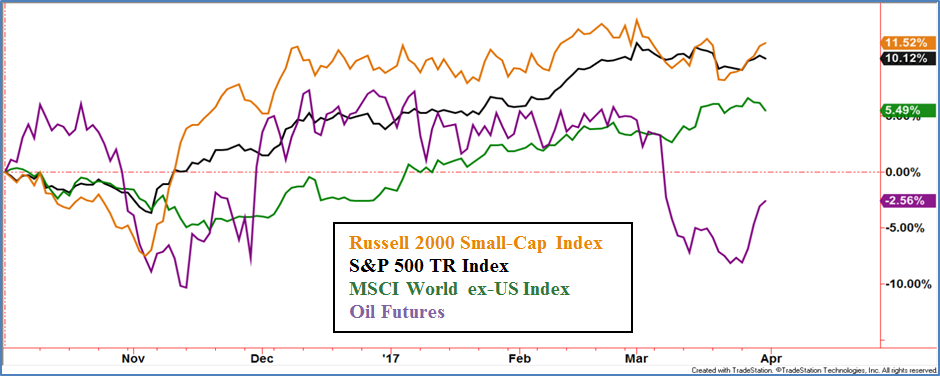
Domestic equity markets were sluggish in March. In multi-months trends, the small-caps as displayed by the Russell 2000 Small-Cap Index, has been a laggard but its performance in March was more in-line with the large-caps (S&P 500 TR Index). Foreign markets as displayed by the MSCI World ex-US Index continued to build on its uptrend. Oil prices are shown above to display how equity markets often have a negative response when oil falls sharply. In early March, the sharp decline in oil had only a muted response, perhaps as investors display a bullish leaning toward other fundamental factors.
SecurityMaxx Strategies – An Inside Look
HIGH YIELD BOND
The strategy exited to the safety of cash early in the month, as trends within the high yield market were put into question. After a brief consolidation, high yield bonds regained positive traction and the strategy became reinvested.
LEVERAGED HIGH YIELD BOND
The strategy entered March with core positions but added leveraged positions early in the month. Core and margined positions were quickly reduced, still relatively early in the month, as the high yield bond market lost momentum. Core positions were added late in the month as conditions improved.
DYNAMIC HIGH YIELD
This strategy tends to be quite nimble and after no trades in February, March was rather active in order to help navigate the consolidation within the high yield market. The strategy closed the month invested.
INTERNATIONAL SECTOR
Improved momentum following the December turnaround prompted a steady increase in foreign equity exposure throughout January which allowed for participation in the ongoing rally in February and March. Emerging markets were the focus early in the month but transitioned more toward developed markets as the month progressed.
CORE FOCUS
The Major Trend Index (MTI) remained positive during March despite stalled performance by the stock market. The current allocation is 51% large cap U.S. stocks, 10% global high yield bonds, and the balance in moderate duration diversified U.S. fixed income. International and Emerging Market stocks have outperformed the U.S. market during the first quarter and therefore, are candidates to be added to the allocation in the 2nd quarter.
LONG SHORT SECTOR
This strategy had an average net exposure of approximately 39% for March. Its low volatility character comes from combining trending sectors and style-based investments with hedging techniques. Macro characteristics of the stock market continued to warrant a more defensive stance. This included shying away from narrow sub-sector choices that tend to have higher volatility than broader-based sectors.
| BENCHMARK PERFORMANCE |
TOTAL RETURN |
TOTAL RETURN |
|
Mar |
YTD |
| Barclays High Yield VL Index |
-0.26% |
2.44% |
| All US Domestic Equity Funds (Avg. US Stock Fund) |
0.16% |
4.78% |
| NASDAQ Composite Index (w/dividends) |
1.57% |
10.13% |
| S&P 500 TR Index (w/ dividends) |
0.12% |
6.07% |
| MSCI World ex USA Index |
2.61% |
7.98% |
Barclays U.S. AGG: Bond Index is a market capitalization-weighted index comprised of USD-denominated, investment-grade, fixed-rate, taxable bonds. The index includes government securities, mortgage-backed securities, asset-backed securities and corporate securities all with a maturity of greater than one year.
Barclays High Yield VL Index includes publicly issued U.S. dollar denominated non-investment grade, fixed-rate taxable corporate bonds that have a remaining maturity of at least one year, regardless of optionality.
S&P/LSTA U.S. Leverage Loan 100 Index comprised of the 100 largest bank loans with floating rate coupons.
iShares iBoxx High Yield Corporate Bond ETF (HYG) which seeks to track the investment results of an index composed of U.S. dollar-denominated, high yield corporate bonds.
CDS (Credit Default Swaps) a financial contract whereby a buyer of corporate or sovereign debt in the form of bonds attempts to eliminate possible loss arising from default by the issuer of the bonds. This is achieved by the issuer of the bonds insuring the buyer’s potential losses as part of the agreement.
Standard and Poor’s 500 TR Index (S&P500) is a capitalization weighted index of 500 stocks representing all major domestic industry groups and assumes the reinvestment of dividends and capital gains.
NASDAQ Composite Index is a broad-based capitalization-weighted index of stocks in all three NASDAQ tiers: Global Select, Global Market, and Capital Market.
All US Domestic Equity Funds: Is an arithmetic average of all US Domestic Equity Mutual Funds, provided monthly by the Wall Street Journal
Russell 2000 Small-Cap Index measures the performance of the small-capitalization sector of the U.S. equity market.
MSCI World ex USA Index (MXWDU) is a capitalization weighted index that monitors the performance of stocks from around the world other than the US.
Major Trend Index (MTI, developed by The Leuthold Group LLC) is designed to recognize major market trends rather than intermediate moves, combining over 180 individual components to assess the overall health of the stock market. It includes Intrinsic Value Indicators, Supply/Demand Tools, Market Action Tools, Attitudinal Gauges, and Economic/Interest Rates/Inflation Measures. Revisions and weighting adjustments are made from time to time.

 The CSFB High Yield Index (CSHY) is designed to mirror the investible universe of the $US-denominated high yield debt market. *Data obtained from Bloomberg.