Understanding the complexities of the bond market is important when evaluating the types of products and exposure a portfolio has within the asset classes of fixed income. The terms “duration” and “maturity” differ in the world of finance from their common everyday use. In finance, both duration and maturity refer to different characteristics a bond may have. Clarification of the definitions should help those wishing to dive a little deeper into what may be subtle yet important difference among bonds whether looking at fixed income mutual funds, ETFs, or individual bond issues.
MATURITY
How long something lasts is commonly associated with the word “duration”. An example of this would be a movie with perhaps a duration of two hours or a roller coaster with a duration of one and a half minutes.
When assessing a bond or a bond portfolio, how long the bonds last, if not sold early, is closer to the definition of “maturity”.
A 30-year Treasury Bond, as the name implies, matures or pays back its face value 30 years from its initial date. Investors are not obligated to hold the bond for the entire period as they have the option of being sold within the secondary market. Therefore, ten years after its initial offering, a 30-year Treasury Bond will have a maturity of twenty years but is still called a “30-year” Treasury Bond.
Individual investors or portfolio managers can buy or sell bond holdings to adjust the average maturity of the portfolio. Why would they want to do that? Generally speaking, the further out the maturity, the wider the potential price swings of the market value of the bond. That is a very important concept to bond investors, but it is a general concept as compared to an attempt at better detailing the relationship when we cover duration.
Keep in mind bond investors recognize two types of return, the first is the interest payment income which may be paid quarterly, semi-annually or even annually. If investing in a fixed-income mutual fund, interest payments are in the form of mutual fund dividends and may be paid monthly. Those payment cycles will play a role when duration is covered. The second type of return is from price changes of the bond itself (why maturity matters). Putting the two types of returns together, an investor gets the “total return”.
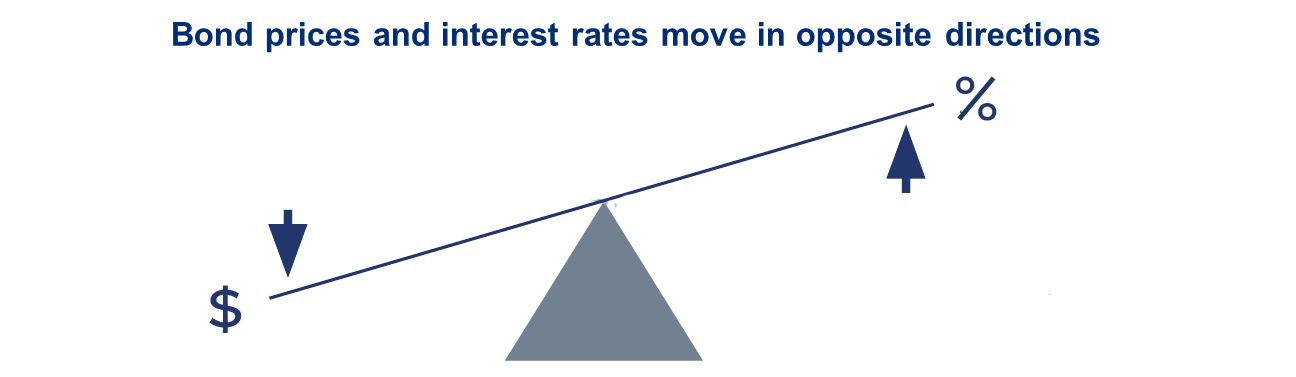
Bonds are often quoted with two yields. See the diagram below to understand the relationship between the bond’s price and its interest rate (or coupon rate).
- A bond is quoted with its “coupon yield”. This refers to the annual interest payable as a percent of the original face or par value. An 8% bond with a par value of 1000 would receive $80 per year.
-
- Coupon/Interest Rate= 8%
- Original face or par value= $1,000
- Math= .08(1000)= $80
- The second is the “yield to maturity” (YTM). This quote takes into account the amount of years left until the bond matures and the impact the market and secondary trading of the original bond has had on the investors final total return.
- Example: 10 years later the original 8% bond with a par value of 1000 is actually trading at $950. Remembering the above diagram, this means the coupon/interest rate would be higher than the original 8%. So what would be the bond’s yield to maturity?
- The formula for YTM takes several things into account:
1. Original Coupon/Interest Payment (C)
2. Original Face or Par Value (F)
3. Price bond was purchased (P)
4. Years to maturity (n)
- If you plug in all the numbers and calculate the YTM when n=20 (10 years later…) the YTM quote is 8.46%
- Let’s say that 5 years later, interest rates have dropped and now the bond is purchased in the aftermarket for $1060. The Yield to Maturity is 7.38%
So what’s the bottom line when it comes to maturity?
Other than a few reasons that would cause a bond to end its existence prior to maturity, the life span of a bond tells an investor how long the bond may be exposed to risk – the primary one being the erosion of its value (purchasing power) when inflation is present (higher bond price, and a lower return than the coupon rate as in example 2 on YTM).
DURATION
Plain and simple, duration is the measure of a bond’s sensitivity to changes in interest rates. Complexity increases in the details of various ways duration is calculated. We will quickly outline the calculations but then then circle back and focus on the broader concept and why investors look at duration in conjunction with maturity.
Macaulay duration, modified duration and effective duration are three types of duration calculations. Investors will more than likely run across effective duration numbers. It is calculated by taking into account how fast a bond’s initial purchase price will be repaid based on its cash flow – this may be a weighted average if looking at a bond portfolio such as in an ETF or mutual fund.
Despite the fancy math of the different versions, duration is more of a concept and not a tool to measure an exact expected price change of the bond when interest rates change.
So what’s the bottom line when it comes to duration? An example should drive the concept home.
An investor that purchases a bond with a face or par value of $1000 would naturally wonder how much that price could be impacted by changes in interest rates. If a bond has a duration of 6 years, then a 1% change in interest rates should cause the bond to lose approximately 6% (to about $940). Keep in mind the image of a see-saw on a playground conveying the idea that when interest rates go up, bond prices go down and the opposite is true.
As noted earlier, duration is more of a concept that estimates the impact to the bond when interest rates change. It is an estimation of the amount of up/down swing in that see-saw image. Ultimately, market participants determine price, but keep in mind market participants would probably be using models to calculate duration in an attempt to determine supply (selling) and demand (buying).
You may have noticed the duration example had the term listed as years. That is the norm used to note duration and also the probable reason why it is can be easily confused with maturity. Recall that the formula(s) for duration measured how long it took for the cash flows to repay the initial investment.
Now, the bottom line of the bottom line. Two bonds may have the same maturities, but their sensitivity to interest rate changes may be different. Investors and portfolio managers not only can diversify holdings in regards to when the holdings may expire or mature, but now can diversify holdings in regards to the possible volatility or impacts to bond price movements as interest rates change.
Take high yield bonds for example – according to the iShares website (www.ishares.com), the High Yield Bond ETF (HYG) has a Weighted Average Maturity of 4.15 years and an Effective Duration of 3.59 years. On the same website, the 3-7 Year Treasury Bond ETF (IEI) has a Weighted Average Maturity of 4.70 years and an Effective Duration of 4.42 years. Morningstar (www.morningstar.com) lists the Guggenheim Floating Rate Fund (GIFIX) has having an Average Maturity of 5.12 years and an Effective Duration of only 0.27. The bonds within these portfolios have, on average, a relatively similar period of time until the principal is assumed to be paid as shown by the average maturities. However, high yield bonds are implied to have greater insulation to changes in interest rates versus the 3-7 year Treasuries. Floating rate, as the name implies, has the characteristic of periodically adjusting their interest rate payouts making them even less susceptible to rate changes than the other two. An investor or fund manager may be comparing these potential investments in their due diligence process. If they have an opinion on the direction and speed of possible interest rate changes, then duration would be an important factor.
Those newer to fixed income assessment often start with seeing the bond market as one entity, perhaps thinking “the bond market was up today…”, etc. That is certainly not the case. The next step in learning more about fixed income is to see how various classes within the bond market actually differentiate themselves in price direction and volatility. Maturity and Duration are simply two measures among many that investors explore when attempting to separate the parts that make up the bond market.

 Created with TradeStation. © TradeStation Technologies, Inc. All rights reserved.