Category: Market Research Page 8 of 12

Brexit and Active Management

Stock markets around the globe reacted by moving sharply lower on Friday, 6/24/16, and again on Monday, 6/27/16. Chart-based or technical analysis-based investors point out that chart patterns and indicators often give warnings ahead of declines.  In some cases, however, declines can be swift and without warning.  In most cases, these are initiated by news events in which there are very low probabilities of foreknowledge by even a small number of individuals.

Low probability news events can be labeled as “UFOs” or “Unforeseen Fundamental Occurrences”

Terrorist events and natural disasters are the most common “UFOs”. Interest rate changes and currency devaluations can be surprises but in many instances, some clues may be present in price action ahead of the actual event.  In many cases, dates of certain news events are known ahead of time but the outcome may be a shock to market participants.  Examples of this would be scheduled economic releases, including Federal Reserve policy announcements, as well as earnings releases from major companies.   Most recently, the vote for Britain’s possible exit of the European Union was known, but the actual result of the vote obviously was a surprise to market participants.

So how should investors respond to UFOs? Some readers may see it as a blatant omission of valid strategies if not mentioned, but one response is the use of option strategies of varying degrees of sophistication.  In this article, however, we are going to focus on a broader, more practical concept.

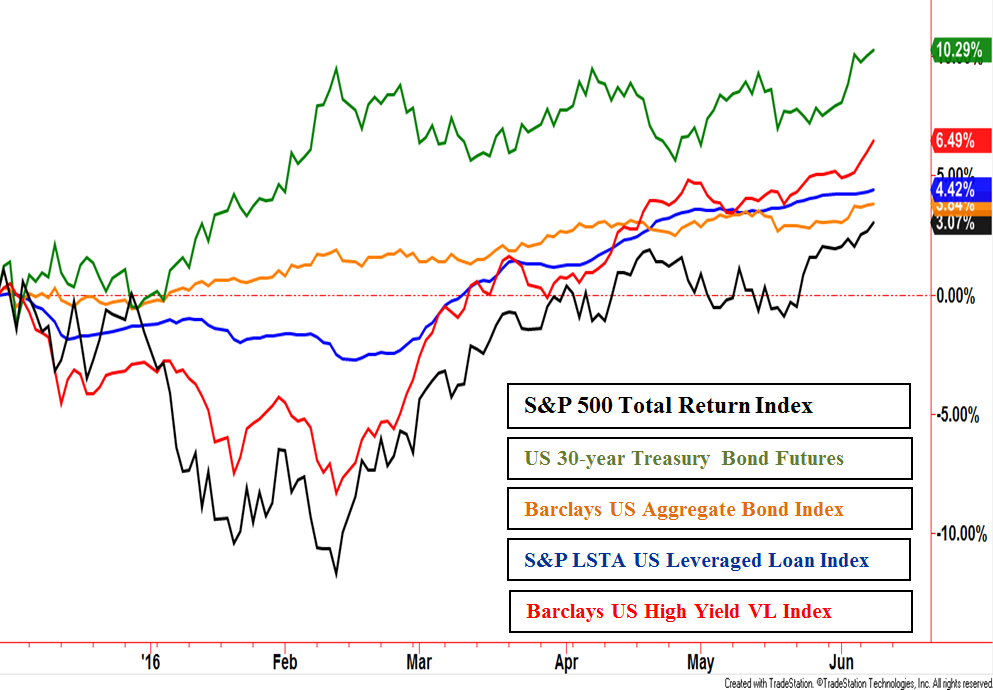
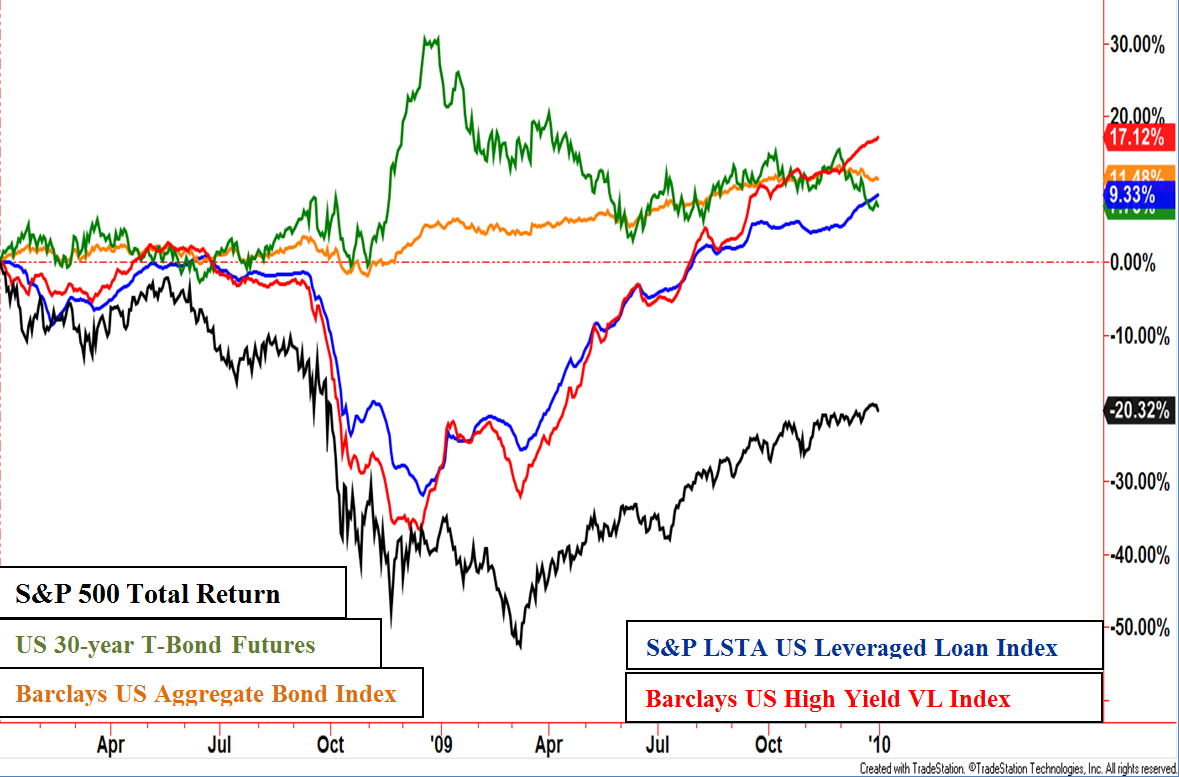
News events happen on a daily basis which means we need to define UFO shocks versus other times of weakness. For now, we will limit the discussion to downside shocks but the concepts will generally transfer over to upside surprises.  Chartists or technical analysis-based investors, can define UFO type of shocks in many different ways.  The underlying concept behind technical analysis is that price action, and various market related data, conveys the net stance of market participants – bullish or bearish and the degree of their convictions through buying and selling intensity.  Logically, shocks mostly run counter the prevailing trend. With trend following being so popular for charting reasons or fundamental reasons, a large number of investors can be caught off-guard.  This results in a herd mentality stampede.

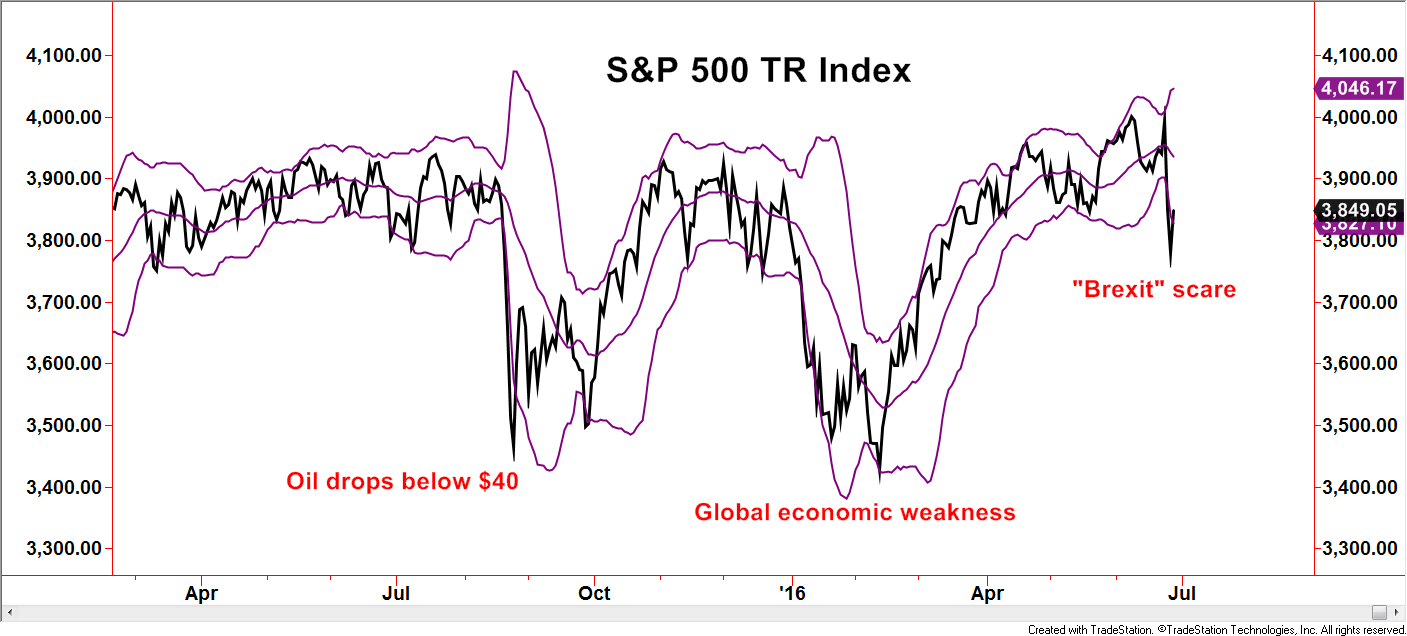
A popular technical choice is the use of Bollinger Bands. These display a moving average with upper and lower lines or bands that respond to the volatility of the underlying investment.  Movements outside the bands by the underlying investment, the S&P 500 Total Return Index for example, define rare events relative to the prevailing trend and volatility.  The chart below displays a number of these periods in which the selling intensity was robust enough to get the S&P below the lower band.  These periods invariably have news events behind them.  Notice this method separates the more intense movements, the shocks, versus the more common periods of trending and volatility.  Chartists tend to not get overly concerned with the details of the story behind the news, rather, the market’s reaction.  Simply put, price movements outside of the bands can define a reaction to an Unforeseen Fundamental Occurrences.

BrexitCreated with TradeStation © TradeStation Technologies, Inc. All rights reserved

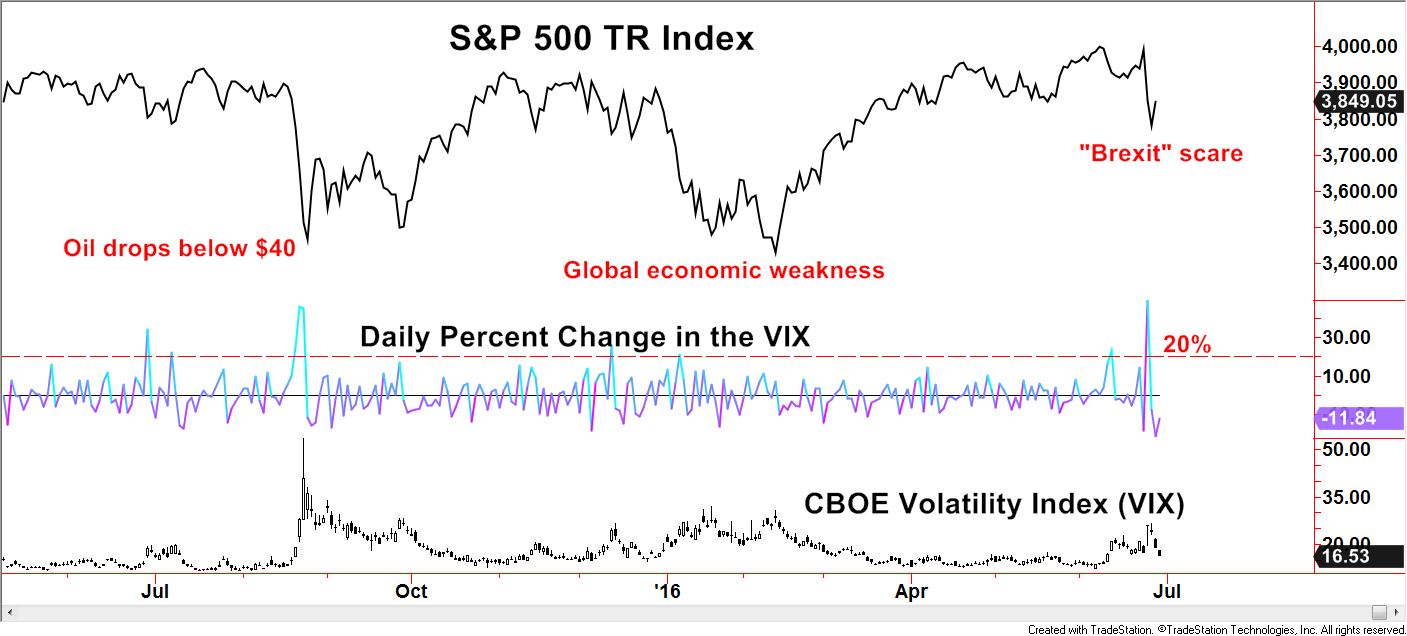
Another popular method is to gauge the CBOE Volatility Index (VIX). The VIX is often referred to as the “Fear Gauge” as it tends to spike during times of negative market shocks. – (See chart below) Even though only two charting methods have been shown, there are numerous ways to define shocks.

Brexit Vix
Created with TradeStation © TradeStation Technologies, Inc. All rights reserved

The primary reason to have a mechanical or disciplined method of defining these events is because in the moment, emotions from the UFO event tends to cloud judgement.  Being able to identify these periods as being out of the ordinary can bring an investor back to the reality of the next step.

“Failing to plan is planning to fail”  – Benjamin Franklin

That pithy saying is full of wisdom, especially for the chart-based investor.  Once again, how does an investor respond to “Brexit”, a terrorist event, a sharp decline in oil, China lowering growth expectations, or an expected sour economic release?  When UFO’s occur, don’t try and overanalyze the content of the news but simply stay focused on your trading plan.  Yes, that assumes a trading plan is in place.  It is similar to the advice from a doctor or a trainer, “if you want to lose weight, you need to exercise”.  Thanks Captain Obvious!  This advice may be easier said than done but the goal is to develop a resistance to the emotional knee-jerk reactions that can pull an investor away from a trading plan.  A whipsaw may be the result, selling then rebuying soon after, but risk controls must be a priority.

Even if a trading plan is not an unemotional black box, rules based method, a logical, qualitative strategic approach can be applied. For example, setting investment exposure at levels in which the market response in either direction would be acceptable.  That way, an investor should not find themselves too far behind benchmarks if a reduction in exposure after a UFO is followed by a surprise rebound.  At the same time, if the market continues lower, at least some steps would have already been taken to reduce risk.

Articles related to the “Brexit’s” potential impact to the world’s economy are a dime a dozen right now. Such articles may add color to one’s understanding of the event but the most useful advice may be to simply prioritize the disciplines adherence to an established trading plan.

Disclosures

S&P 500 TR Index: is a capitalization weighted index of 500 stocks representing all major domestic industry groups and assumes the reinvestment of dividends and capital gains. It is not possible to directly invest in any index.

This writing is for informational purposes only and does not constitute an offer to sell, a solicitation to buy, or a recommendation regarding any securities transaction, or as an offer to provide advisory or other services by Spectrum Financial, Inc. in any jurisdiction in which such offer, solicitation, purchase or sale would be unlawful under the securities laws of such jurisdiction. The information contained in this writing should not be construed as financial or investment advice on any subject matter. Spectrum Financial, Inc. expressly disclaims all liability in respect to actions taken based on any or all of the information on this writing.  For full disclosure please see disclosures page here.

A Lesson in Bonds

Media outlets routinely convey public opinion through articles, blogs, interviews, etc. In many instances, the media helps to perpetuate public opinion even if the facts are skewed.  Over the last year or more, there has been an onslaught of articles and interviews implying how an environment of rising interest rates should be bearish for the bond market.

Comments today will focus on the inaccurate implication of the term, “bond market”.  The italic focus is at the heart of the matter,  implying that the bond market is a singular entity.

The stock market is also portrayed as a singular entity but there tends to be greater public awareness of differentiating characteristics such as growth stocks versus value stocks, speculative versus defensive as well as various stock exchanges.  Bonds also have various classes or groups, each with characteristics that may have some similarities with others but many characteristics that are in stark opposition to each other.  Understanding the basics of such characteristics is behind the investment concept of bond rotation.

Price Movements

We will first just touch on a few characteristics and then zoom in on one with a very practical aspect in regards to rotation. The perspective of our assessment will be in regards to the characteristics of their underlying price movements.  Many investors like to focus on credit rating and maturity.  These two factors act independently from each other in their influence on price action which is an important concept when brought together.  Credit ratings are opinions by specific agencies regarding the likelihood of repayment of the debt by the underlying company.  The logical conclusion is the higher the rating, the lower the risk of default.  This attractive quality plays a role in dampening price volatility.  A bond’s maturity outlines the length of the debt obligation which may be 90 days, 5 years, 10 years, 30 years or some other time frame.  In most cases, the investor is not obligated to hold the bond until maturity but can sell the bond to another investor in the secondary market.  This concept is similar to the idea of a homeowner having a 30-year mortgage but is free to sell their house prior to the completion of the 30-year mortgage agreement.  The future is unknown but the idea is the longer the maturity, the more potential for events that affect risk.  That means a higher price volatility character as maturity increases.  Now let’s combine these two independent factors in order to get a primary influence to a bond’s price action character.  A highly rated investment with a very short maturity should have its dominant characteristic as being “low volatility”.  At the opposite end of the spectrum, a low rated bond with a long maturity will have its dominant price characteristic as being highly volatile.  Therefore, a short-maturity but low-rated bond may trade with some similar volatility measures as a higher rated bond but with a longer maturity.

Bonds are traditionally divided into classes or groups and then sub-groups. Each of these may have some dominant or defining characteristic but even then, the rating and maturity combination will generally define price action statistics.  Common categories look like the following (from Morningstar):

Taxable Bond                                                         Municipal Bond:

Government                                                                 Muni National
Inflation Protected Bond                                           High-Yield Muni
Nontraditional Bond                                                  Muni Single State
Bank Loan
Preferred Bond
High-Yield Bond
Multi-sector Bond
World Bond
Emerging Markets Bond

Now that that the volatility characteristic has been covered, let’s focus on price direction. In order to establish a baseline for assessing direction, the S&P 500 Total Return Index will be used.  The oversimplified way we will measure this is if the bond group moves generally in the same direction of the S&P 500 or not.  While not all groups are displayed in the charts below, it is clear that each group represented has its own price action personality.  Government Treasury Bonds as represented by the US 30-year Treasury Bond Futures have a tendency to move counter the stock market as represented by the S&P 500 TR Index.  Quality rated bonds as represented by the Barclay’s U.S. Aggregated Bond Index also have a tendency to move counter the stock market.

High Yield Lesson
Created with TradeStation © TradeStation Technologies, Inc. All rights reserved

The word “tendency” is used because there are plenty of exceptions to this rule of thumb. During times of stress in the economy and other times that evoke heightened levels of fear, investors often move into higher rated corporate and government bonds due to the perception their money is at less risk of default loss. The counter-equity direction has been muted over the last several months primarily due to reasons relatively new to the investment landscape.

The concept of fearful investors, concerned about deteriorating economic conditions, is still most likely responsible for propping up the quality-rated bond groups.

A rising stock market would indicate investors are not fearful but optimistic toward the economy.  The twist is that the fear from a lack of economic optimism is coming from overseas.  Negative interest rate policies and fears of a global economic slowdown have been driving foreign investors looking for the relative safety or perception of safety, to the US quality bond groups.  This “flight to safety” is also being called a “risk-off” theme.

Risk Off – Risk On

If there is a “risk-off” theme, then there must be a “risk-on” theme.  It is important to realize risk is not specifically defined but is a relative measure.  Companies and various debt entities more reliant on economic expansion have less likelihood of interest payment default during those growth periods.  Therefore, investors have a tendency to be eager to own those classes during economic expansions.  High yield and floating rate/bank loan groups are represented in the charts above and below with the Barclays US High Yield VL Index and S&P LSTA US Leveraged Loan Index, respectively.

In 2008, the banking crisis caused a tremendous amount of fear among investors. Government and other quality rated bonds were not fully immune to selling pressure but those classes and their groups ultimately moved counter the stock market, generally speaking.  They also moved counter the high yield and bank loan bond groups.  During the stock market recovery in 2009, the flight to the relative safety of government bonds was mostly reversed as the high yield and bank loan bond groups recovered sharply.  Quality bonds, as represented by the Barclays US Aggregate Bond Index mostly lost its counter stock market tendency but maintained its lower volatility character.

High Yield Lesson 2
Created with TradeStation © TradeStation Technologies, Inc. All rights reserved

Headlines in print, television, and other media outlets appear to be trying their hardest to convince the public that a Fed induced, rising rate environment will harm “the bond market”.

Informed investors should be able to recognize that the bond market is multi-faceted.

Some groups may indeed struggle but others should be able to thrive.  Investors looking to bonds as a component to their portfolios should recognize navigating within fixed income, or “bond rotation”, is a viable alternative to exiting the bond market altogether.

Disclosures

S&P 500 TR Index: is a capitalization weighted index of 500 stocks representing all major domestic industry groups and assumes the reinvestment of dividends and capital gains. It is not possible to directly invest in any index.

Barclays US High Yield Very Liquid Index: This benchmark includes publicly issued U.S. dollar denominated non-investment grade, fixed-rate taxable corporate bonds that have a remaining maturity of at least one year, regardless of optionality. The bonds are rated high yield (Ba1/BB+/BB+ or below) using the middle rating of Moody’s, S&P, and Fitch, respectively (before July 1, 2005, the lower of Moody’s and S&P was used). Included issues consist of only the three largest bonds from each issuer that has a minimum amount outstanding of $500 million or more (face value) and less than five years from issue date.

S&P/LSTA U.S. Leveraged Loan 100 Index: This benchmark is designed to reflect the performance of the largest facilities in the U.S. dollar leveraged loan market. Term loans from syndicated credits must meet the following criteria at issuance to be eligible for inclusion. 1) senior secured 2) minimum initial term of one year 3) minimum initial spread of LIBOR +125 basis points 4) U.S. dollar denominated 5) all constituents must have a publicly assigned CUSIP

Barclays U.S. AGG: Bond Index: The Barclays U.S. Aggregate Bond Index measures performance of the total U.S. investment grade bond market. It is a market value-weighted index that tracks the daily price, coupon, pay-downs, and total return performance of fixed-rate, publicly placed, dollar-denominated, and non-convertible investment grade debt issues with at least $250 million par amount outstanding and with at least one year to final maturity.

This writing is for informational purposes only and does not constitute an offer to sell, a solicitation to buy, or a recommendation regarding any securities transaction, or as an offer to provide advisory or other services by Spectrum Financial, Inc. in any jurisdiction in which such offer, solicitation, purchase or sale would be unlawful under the securities laws of such jurisdiction. The information contained in this writing should not be construed as financial or investment advice on any subject matter. Spectrum Financial, Inc. expressly disclaims all liability in respect to actions taken based on any or all of the information on this writing.  For full disclosure please see disclosures page here.

Page 8 of 12

Spectrum Financial, Inc 2023