
GENERAL MARKET COMMENTARY
Following the presidential election, the S&P Stock Index rallied nearly 10% in about five weeks, but remained paused since the middle of December. During that same time, the 30-year government bond went from 2.6% to 3.2%, one of the fastest historical rate increases, while the market priced-in increased inflation expectations.
This rally is the largest post-election gain in the S&P 500 since 1967. But this aging bull-market and extended economic recovery are not without a few significant problems.
One problem would be lofty stock valuations and overly optimistic investor consensus. A second one is the pending interest rate increases by the Federal Reserve. Three more rate increases are expected this year. Another negative market omen is that stock market seasonality in the first year of a new president is historically a negative one.
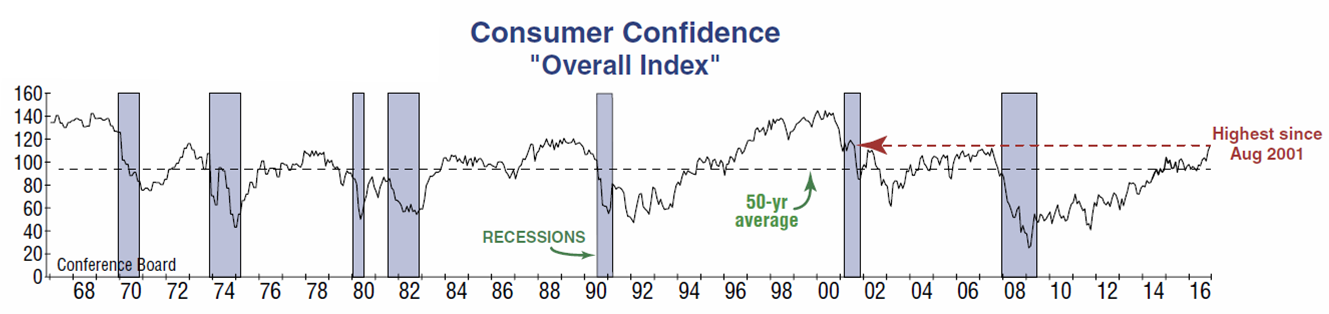
However, the December Consumer Confidence Board Index showed the highest confidence by consumers since August 2001 as seen on chart below. Another leading indicator shows that market breadth continues to climb to a new all-time high, confirming the stock market new high and pointing to favorable prices ahead.
© InvesTech Research, LLC – All Rights Reserved
HIGH YIELD RETURNS
The yield differential between high yield bonds and US government bonds is currently only about 3.8%. This indicates that the yield on high yield bonds is paying 6.3%, where 10-year government bonds only yield 2.5%. A normal range for this yield spread is between 3% and 7%. The lower this number is, the lower the potential returns are. Looking at what happened in 2004, when we were midway in an economic expansion and the yield spreads were about where they are today, the charts below illustrate the returns for the three years following this similar economic period. Total returns for the next few years averaged about 8.5% annually for high yield bonds. If the yield spread continues to drop, high yield bonds should continue to appreciate, but if this spread drops below 3%, a defensive strategy is likely.
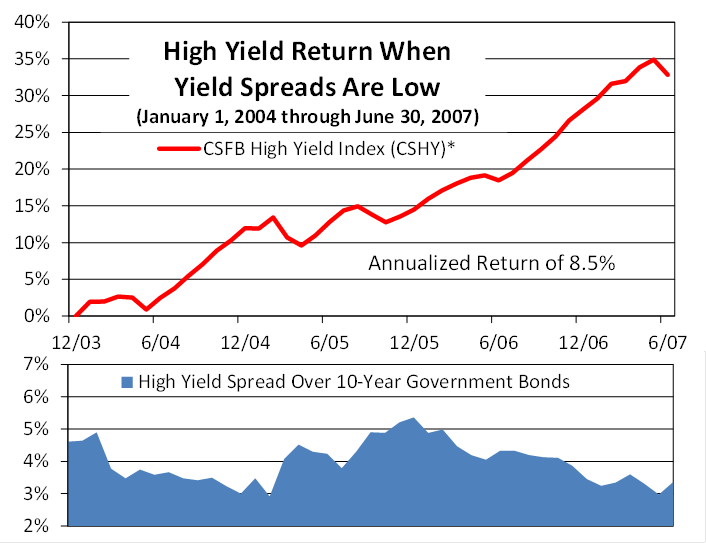 *The CSFB High Yield Index is designed to mirror the investible universe of the $US-denominated high yield debt market.
This blog contains excerpts taken from the January 2017 edition of The Full Spectrum newsletter. To continue reading please download the full copy here: The Full Spectrum: January 2017
Disclosure
Spectrum Financial, Inc. is a Registered Investment Advisor. The Full Spectrum is published quarterly for its investors and account executives. This publication is not intended to offer or solicit investment advice, nor should anyone act upon any suggestions made herein, without individual counseling from your account executive regarding risks involved. There is no guarantee that the recommendations of management will prove to be as profitable in the future, as they have in the past. The information presented in this issue has been obtained from sources believed to be reliable, but its accuracy is not guaranteed. Due to various factors, including changing market conditions, the content may no longer be reflective of current opinions or positions. A copy of Spectrum’s current written disclosure statement discussing advisory services and fees is available upon request. All rights reserved, please notify when quoting.
This writing is for informational purposes only and does not constitute an offer to sell, a solicitation to buy, or a recommendation regarding any securities transaction, or as an offer to provide advisory or other services by Spectrum Financial, Inc. in any jurisdiction in which such offer, solicitation, purchase or sale would be unlawful under the securities laws of such jurisdiction. The information contained in this writing should not be construed as financial or investment advice on any subject matter. Spectrum Financial, Inc. expressly disclaims all liability in respect to actions taken based on any or all of the information on this writing. For full disclosure please see disclosures page here.