
General Market Commentary
This has been a very volatile year for the markets so far, and the uncertainty of potential Federal Reserve interest rate increases and presidential election issues remain to year’s end. The stock market had an impressive rally after the sell-off from Brexit fears, creating new highs for stock market indices. The S&P 500 Index has broken out to new highs, while the small cap Russell Index still lags. High yield bonds have also broken out to new highs, which is a favorable development, since their performance usually confirms the market direction. With earnings season approaching, improved earnings may provide the fuel for further gains ahead.
According to Sundial Capital Research, which projects probabilities for financial markets, the upside probabilities over the short term are less favorable, but are much better for later in the year (click chart to enlarge).
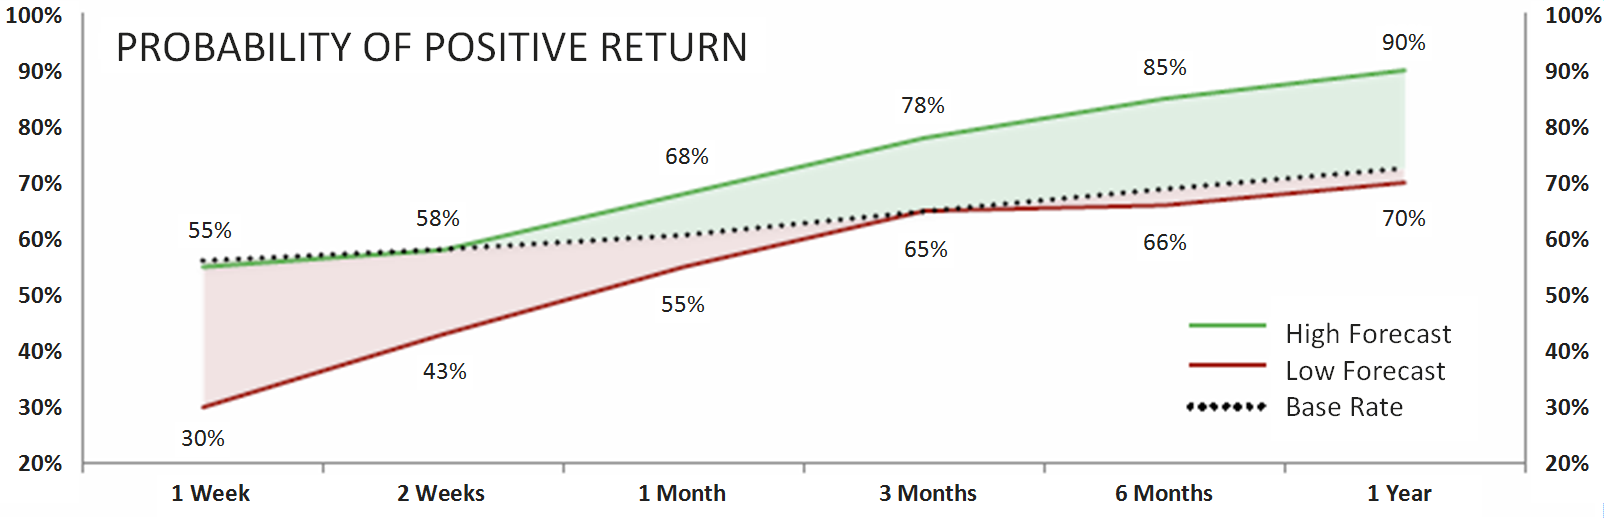 © 2001-2016 Sundial Capital Research, Inc. All rights reserved
Leveraged High Yield Bond History
Managing high yield bonds has been Spectrum’s core investment strategy since offering investment management services in 1988. We have seen about every scenario possible—war, the great recession, over- and under-valuation, and have had experience in all of them.
We understand bonds, and consider them predictable, since we have observed them for over 10,000 days. There are times when it is good to own them, good to stand aside, and even times to consider borrowing money to own more for short periods of time when “the wind is at your back”.
If we can borrow money at 2% and purchase bonds that yield 7%, we can make a net gain of 5% in addition to the 7% bond yield. This is called “carry trade”. However, we need to have liquidity to exit these positions when they are no longer in an uptrend. Since all the funds we use have daily liquidity, we can use this strategy when appropriate without having to ride out a serious decline.
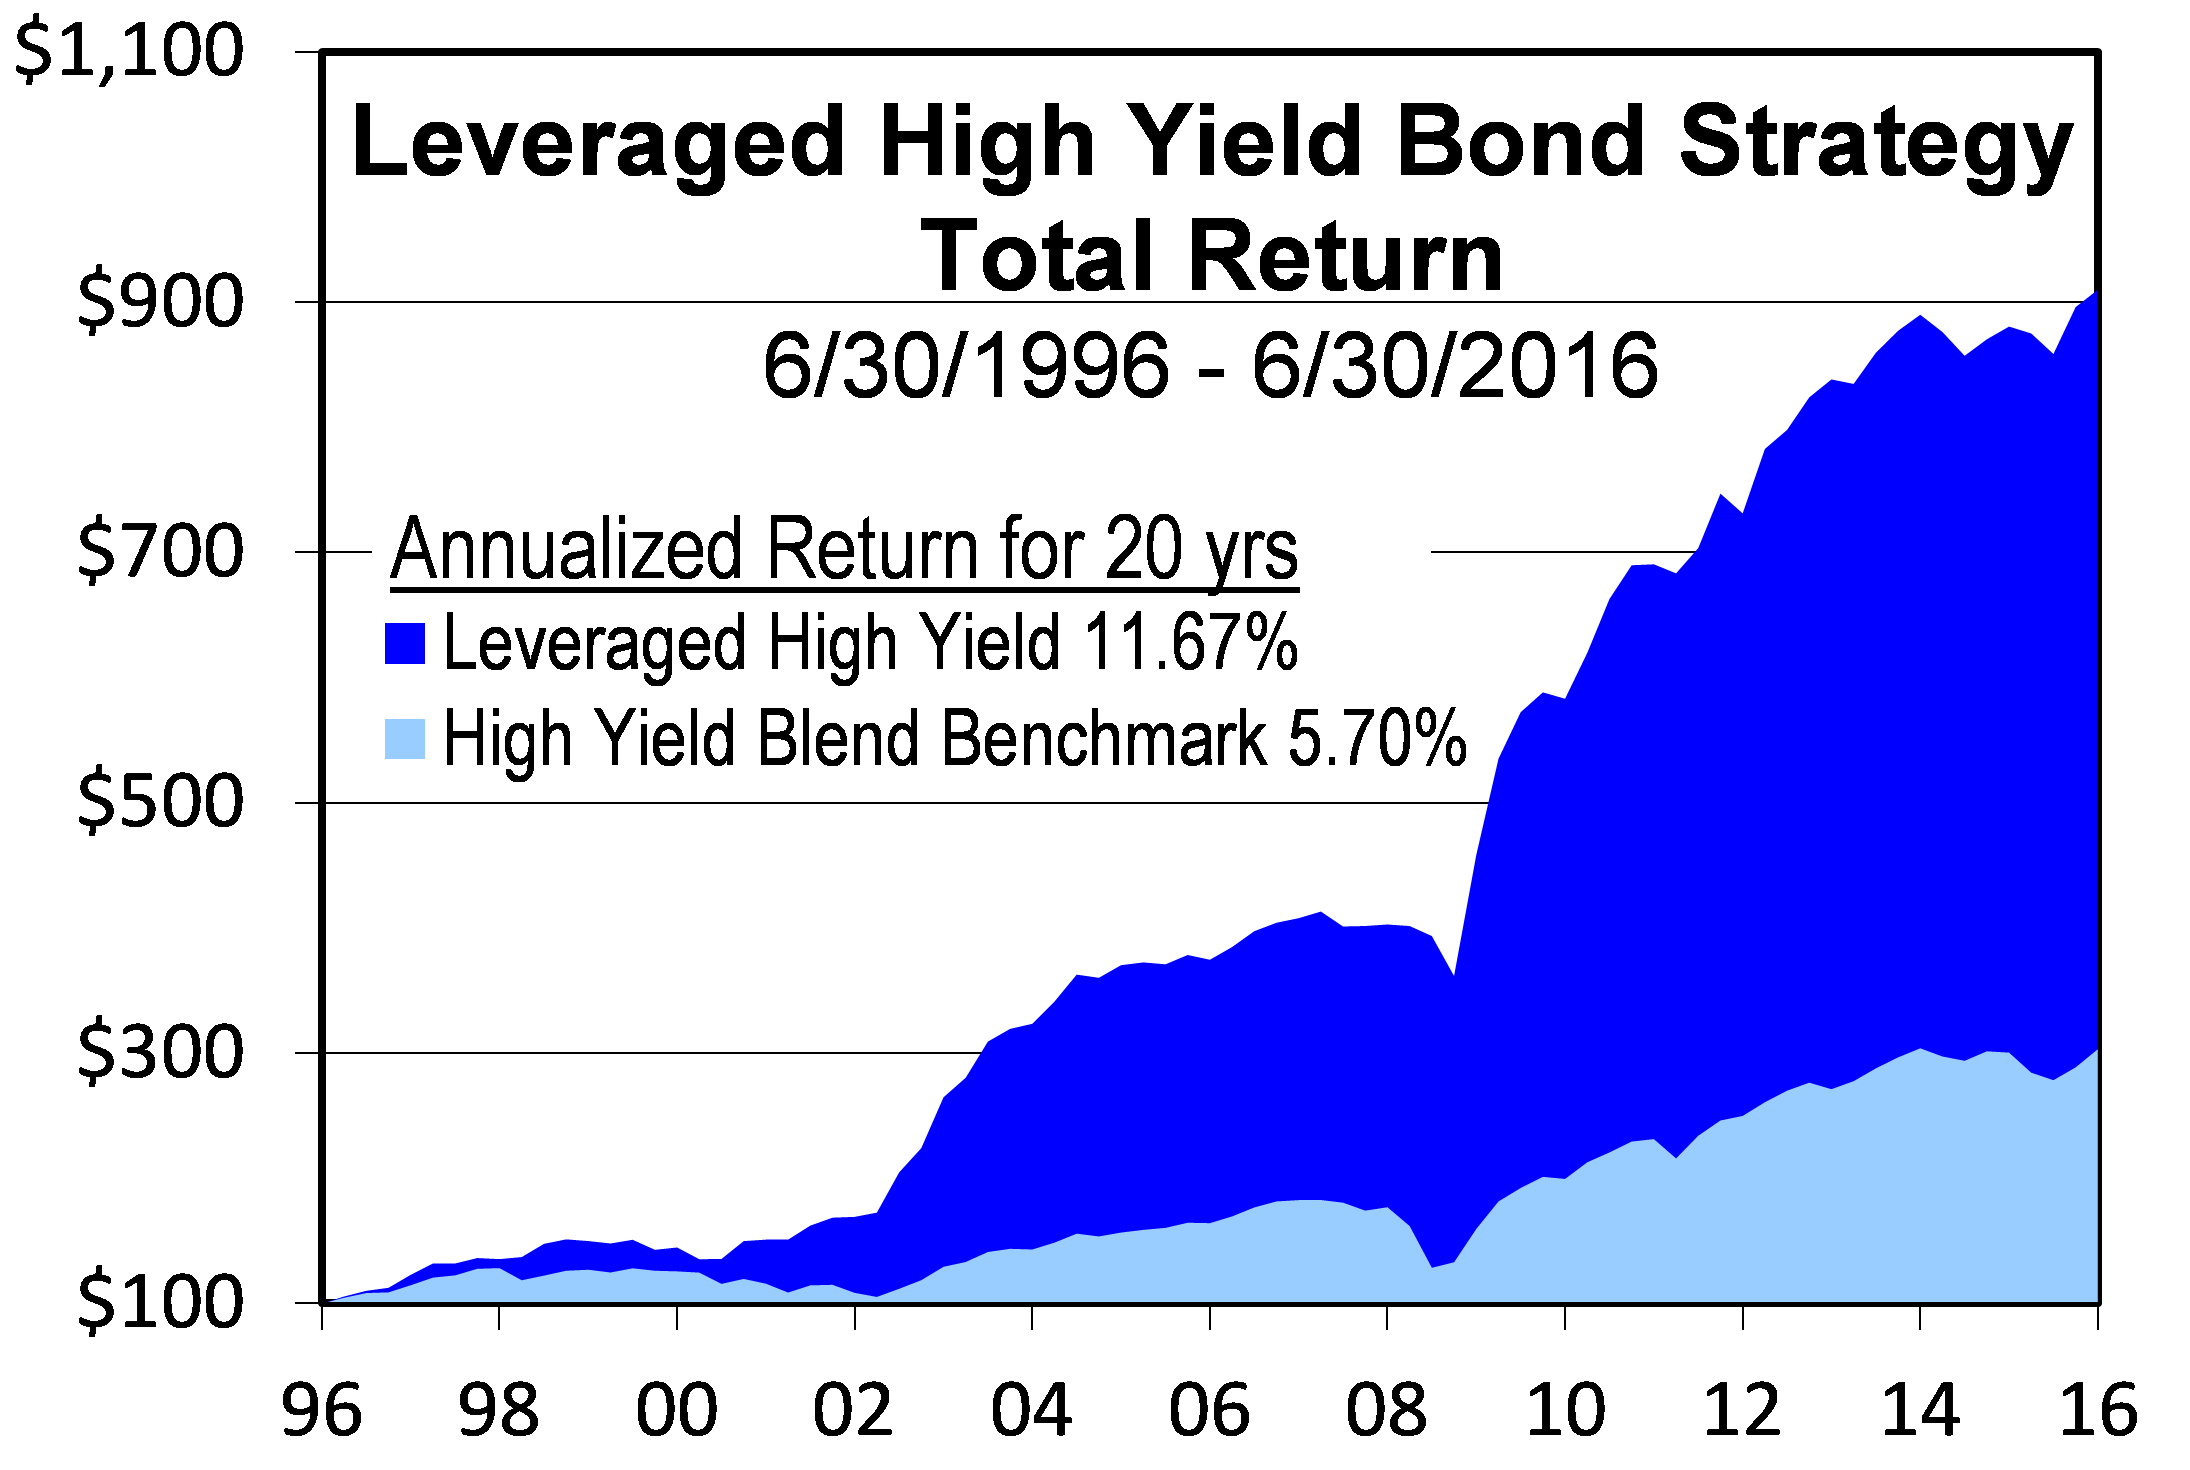 Chart above illustrates cumulative returns on a quarterly basis assuming a $100 initial investment from June 30, 1996 through June 30, 2016, net of fees. Performance calculations are based on actual client accounts having dividends reinvested, no purchases or withdrawals during the period, and may have been obtained from personal or related accounts. The Leveraged High Yield Bond Strategy fee is .63% from 12/31/10 to present, 0.625% through 12/31/2009 and 0.75% prior and is reflected in the calculated performance. The initial commission on funds is not taken into account but could reduce performance. Some performance may vary due to fund restrictions and/or limitations imposed by the mutual fund families. Past performance does not guarantee future results. Current performance may be lower or higher than data quoted. Investors should obtain the fund prospectus and read it carefully to evaluate the fund's investment objectives, risks, charges, and expenses before investing. The High Yield Blend Benchmark uses the Barclays US High Yield Very Liquid Index from present back to 12/31/2010, then Lipper High Current Yield (provided by Lipper) back to 12/31/1989.
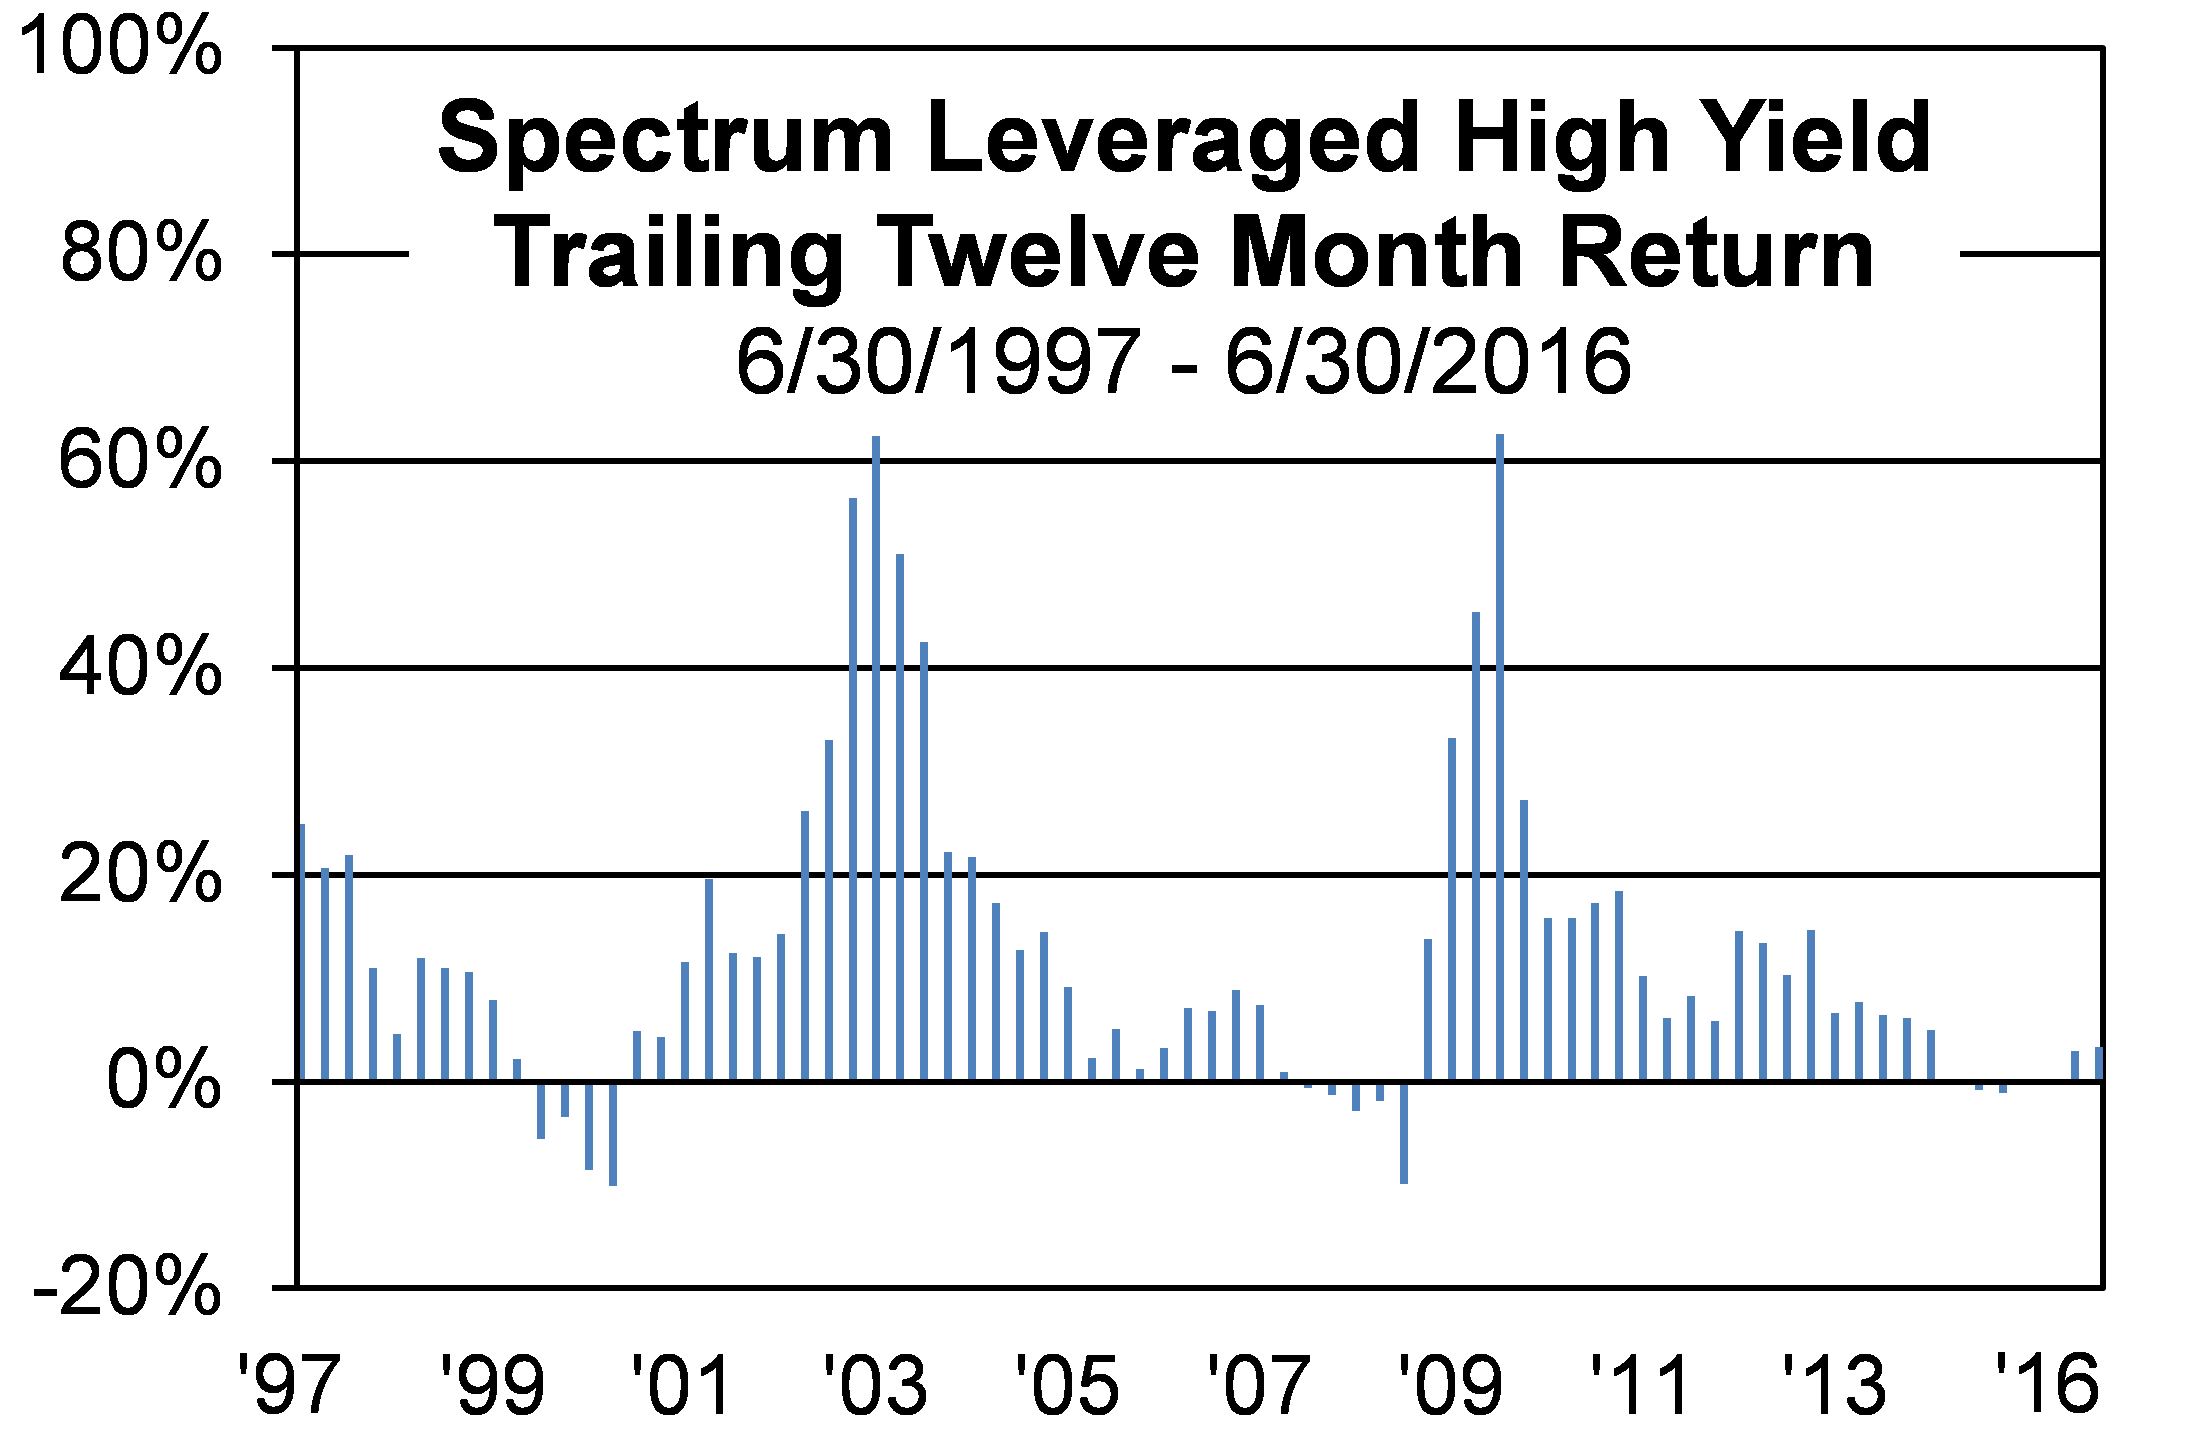
The charts above and below illustrate Spectrum’s actual performance of this strategy for the past 20 years. If we had to use only one strategy, this would be it, since it has produced double digit returns in all kinds of markets with modest losses. The chart below shows a 12-month rolling average for every quarter, with substantial gain potential while minimizing losses. An investment of $100,000 in 1996 would have grown to almost $900,000 for an annualized return averaging 11.67% over the 20-year period. Some of these strategies are also used in Spectrum’s new Low Volatility Fund.
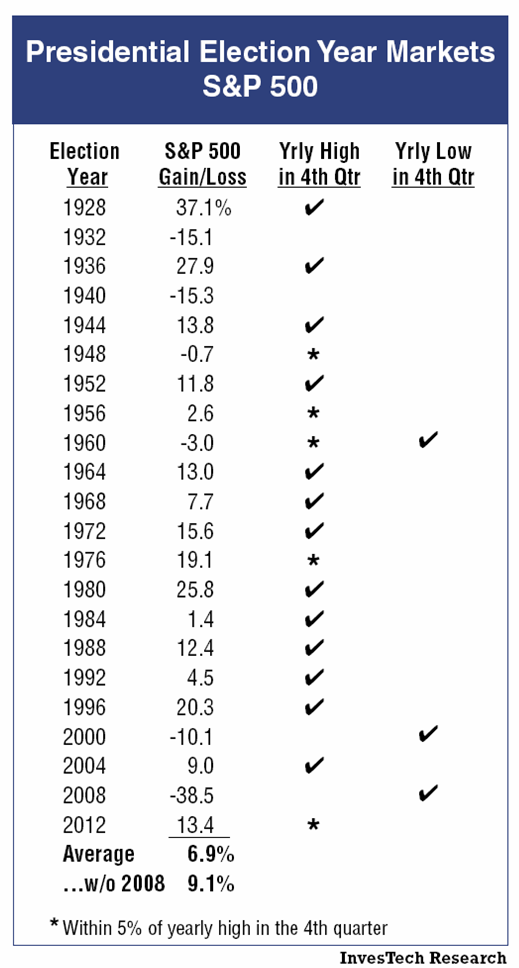
Presidential Election Year Market History
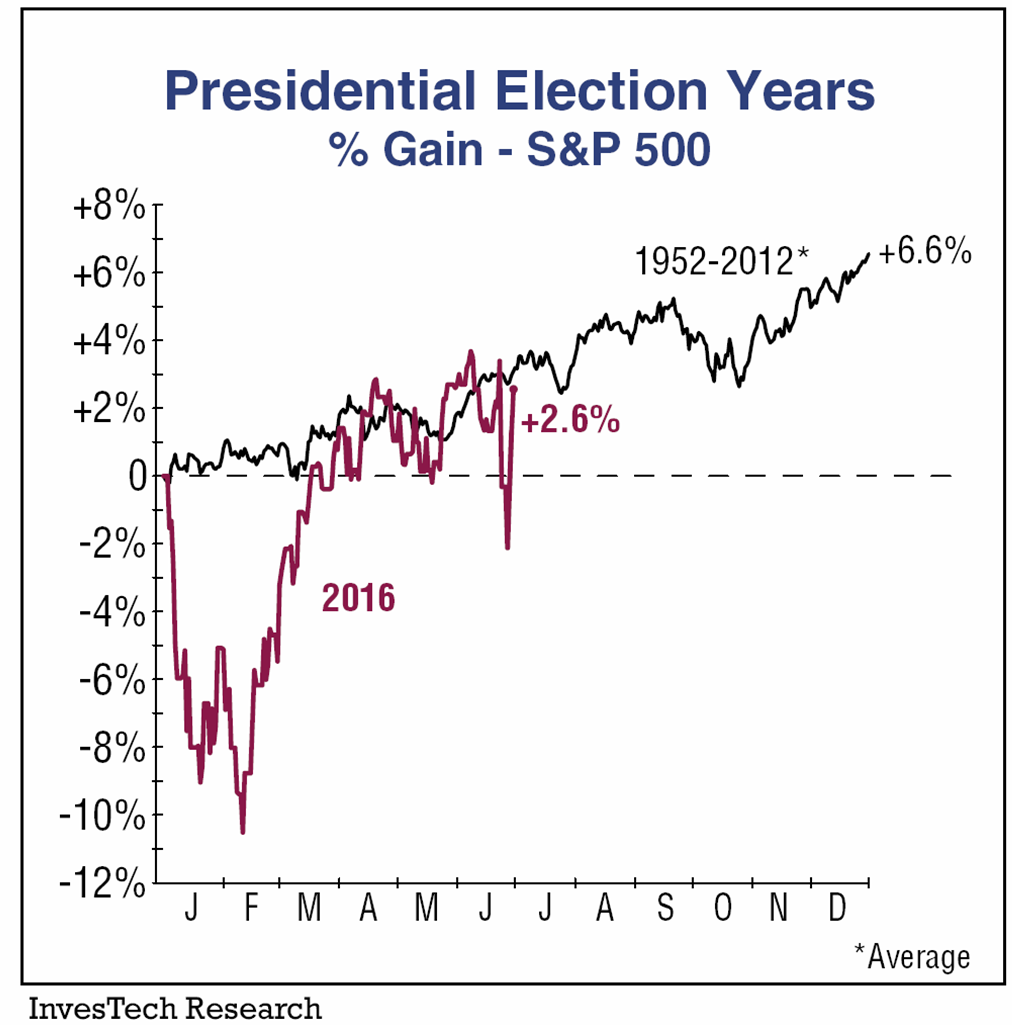
If the presidential election year returns for the past 60 years could be averaged, the gain for the S&P 500 would be 6.6% as illustrated on the chart below.
© InvesTech Research, LLC – All Rights Reserved
The graph reveals that the market tends to improve as the year progresses, but often experiences softness toward the end of summer, leading up to Election Day. Gains usually resume once the uncertainty of the election is over. However, 2016 has been anything but an “average” election year with abnormal major market volatility. According to the chart below several trends can be observed:
© InvesTech Research, LLC – All Rights Reserved
- In most cases, Presidential Elections are positive for the market.
- Presidential election years can be more volatile, but that has not determined the outcome.
- When a bear market was not on the radar, a strong rally emerged as the year progressed.
- Most market gains were concentrated in the second half of the year.
This blog contains excerpts taken from the July 2016 edition of The Full Spectrum newsletter. To continue reading please download the full copy here: The Full Spectrum: July 2016
Disclosure
Spectrum Financial, Inc. is a Registered Investment Advisor. The Full Spectrum is published quarterly for its investors and account executives. This publication is not intended to offer or solicit investment advice, nor should anyone act upon any suggestions made herein, without individual counseling from your account executive regarding risks involved. There is no guarantee that the recommendations of management will prove to be as profitable in the future, as they have in the past. The information presented in this issue has been obtained from sources believed to be reliable, but its accuracy is not guaranteed. Due to various factors, including changing market conditions, the content may no longer be reflective of current opinions or positions. A copy of Spectrum’s current written disclosure statement discussing advisory services and fees is available upon request. All rights reserved, please notify when quoting.
This writing is for informational purposes only and does not constitute an offer to sell, a solicitation to buy, or a recommendation regarding any securities transaction, or as an offer to provide advisory or other services by Spectrum Financial, Inc. in any jurisdiction in which such offer, solicitation, purchase or sale would be unlawful under the securities laws of such jurisdiction. The information contained in this writing should not be construed as financial or investment advice on any subject matter. Spectrum Financial, Inc. expressly disclaims all liability in respect to actions taken based on any or all of the information on this writing. For full disclosure please see disclosures page here.