
I recently read “The Four Temperaments” by Rev. Conrad Hock, AngelusPress.org. In it the author describes in detail the good and bad traits of each of the four temperaments: choleric, sanguine, melancholic and phlegmatic. Everyone has a dominant temperament, and, in the book, you can take a simple test to find your own temperament. There are also many online sites that allow you to take a test to determine your temperament. Unlike personality, your temperament never changes with time!

The fact of the matter is we are all emotional. But we all react in different ways when presented with unintended consequences, surprises, conflict, decision-making etc. (both good and bad). I started working with clients and their investments back in the early 90’s. It amazed me how clients reacted differently to the same 20% move higher or the same 20% move lower in the market, even when they had the same risk tolerance. Most of these reactions were based on perceived expectations correlated directly with their investment temperament.
The chart below shows the emotional rollercoaster ride millions of investors go through from time to time, which may influence investment decision-making. In many cases the decisions investors make can be quite irrational and detrimental to their long-term portfolio goals. Many investors don’t have the expertise and certainly not the time or focus needed to make proper investment decisions.
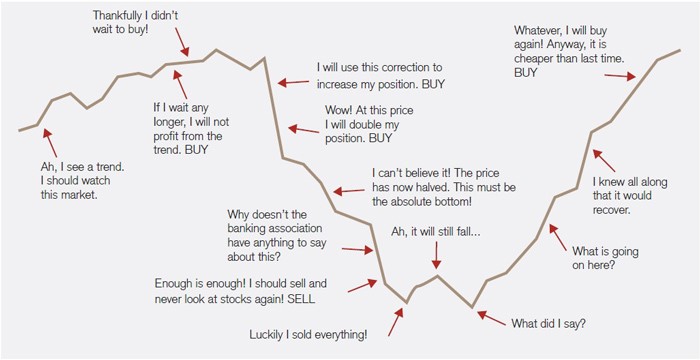 September 2015 edition of ICICIdirect Money Manager Magazine. Source: Credit Suisse
Behavioral Finance is an amazing topic. There have been numerous books written and any Economics/Finance major has taken at least one course on this subject. I won’t turn this into a 50-page thesis, but I would like to explain four investment temperaments I have coined over the last 25 years. These observations include clients, prospects, family, friends and strangers.
- Risk Seeker This type of investor wants to make as much money as possible, regardless of risk. This type wants to make make at least as much as the general stock market going up. On the way down they aren’t happy, but they won’t sell, knowing they will make back their portfolio losses and then some in the future. They are extremely confident individuals. A spin-off of the risk seeker is one that has the same objective, however their reaction during large drawdowns is different. They start to panic, even though they came in with a long-term game plan. They know the risks involved with investing aggressively, but eventually they will sell everything at the worst possible time.
- Controlled Risk-Taker This type of investor wants to make all the money when the general market goes up but wants to lose very little during drawdowns. Much of their investment portfolio is in equity positions. These investors are typically well informed on what the general market is doing. Buy and hold won’t work during periods of large drawdowns, so they employ active management in bad times. They will quickly reduce portfolio equity exposure at early signs of emotional pain.
- Preservationist This type of investor wants to make money with much less risk than the stock market. They feel safer with bonds because they aren’t as volatile. Many investors with this mentality either fear they will run out of money in their retirement years or they want to give it all to their children/grandchildren. They simply want to be reassured that their principal is still there. Any growth is a positive.
- Balancer This type of investor wants to make money in line with stock market returns, but they want downside protection. They know stocks are riskier than bonds and the next bear market will eventually come. They like being in a diversified stock/bond/alternative portfolio.
In late October the S&P 500 gave up all its gains for the year in just a few weeks (see chart below). From the close on October 3rd to the close on October 29th, the S&P 500 fell 9.71%. The Nasdaq 100 Index fell 12.09%, led by one of its largest components, Amazon (AMZN), which fell 21.19%.
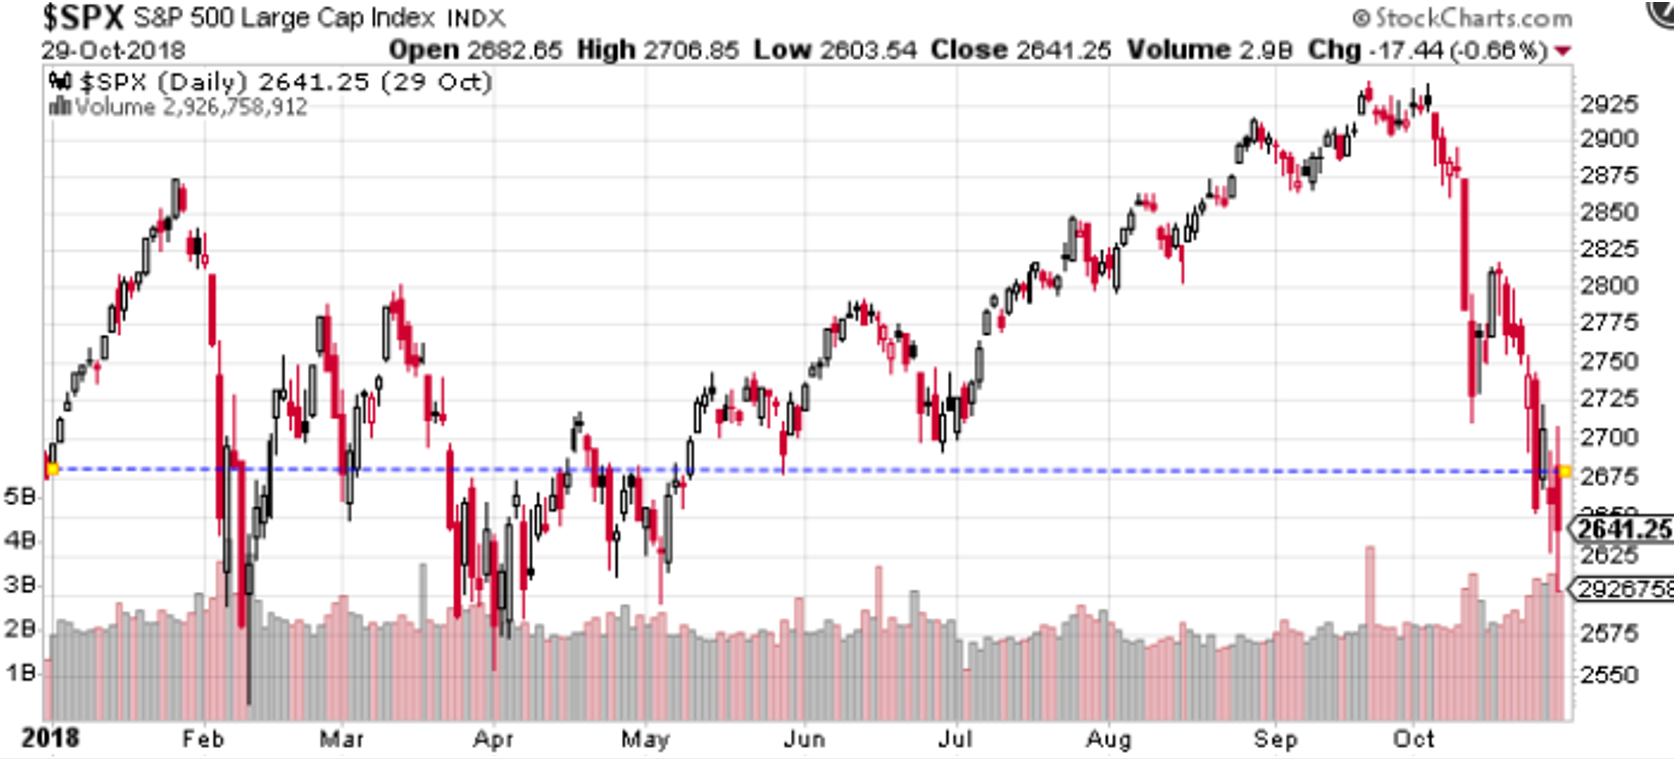 Created with StockCharts.com. © StockCharts.com, Inc. All Rights Reserved.
The most common reactions I heard at the end of October were:
“Everything is fine, it’s time to buy more at a discount.”

“Ouch, that hurt. I don’t know if I should sell or hold here.”

“This doesn’t feel good, but at least my exposure was reduced, and I had a diversified portfolio, including bonds.”

“Is this the start of the next Bear market?!?! Is my money safe???”

“We’re still in a Bull market. I’m diversified and this bump in the road is OK.”

“I’ve enjoyed this Bull market, but this is the second time this year I’ve seen a 10% drop.  I think it’s time to be a little more defensive, unless the market has a good rally.”
As stated before, you can see many different reactions to the same 10%+- move in the market. All these reactions are normal, depending on your temperament. At Spectrum Financial one of the first things we talk to prospects about is their risk/reward profile. Investors must be honest with themselves when asked questions like:
- What is the biggest drawdown you could handle?
- What are your long-term goals? How long are you willing to invest with us to meet them?
- What Index(s) will you compare your portfolio to?
- Is your outlook generally optimistic or pessimistic concerning investing?
- Do you feel you are an aggressive, moderate or conservative investor?
I tell prospects and clients all the time that there are no wrong answers to the above questions. If these questions are answered honestly, it’s much easier to customize a client portfolio based on his/her temperament so that expectations are met. Once allocated, we know we are doing a good job when we see a drawdown in the market like we saw this October and our clients are happy with their return based on their risk/reward expectations. If a client calls disgruntled, in many cases they aren’t as aggressive/conservative as they thought they were. We can easily adjust portfolios accordingly.
What type of investment temperament do you have? Call our office and let us explain our unique investment products and how they can be a great fit for your investment portfolio.
 Created with TradeStation. © TradeStation Technologies, Inc. All rights reserved.