Rebalancing vs. Active Management

Rebalancing and Active Management are two different concepts with two different objectives. Spectrum’s AssetMaxxSM and AssetMaxxGOSM services employ both. Rebalancing has the goal of keeping a standard asset allocation, or portfolio mix, constant despite the changing market conditions based only on investment objectives and personal profiles. Active Management exists to protect from losses, takes advantage of short term opportunities, and safe guards the portfolio during extreme periods of loss. Spectrum Financial believes in using active management and rebalancing: Rebalance the client account with actively managed mutual funds. We chose to be active investment managers since our inception of managing client assets in 1986. Moving client assets in and out of the market, or from one asset class that is losing momentum to another that is gaining momentum, has allowed us to be successful. Managing risk is priority over making money, and active management allows us to achieve results. The Spectrum Funds and the Hundredfold Select Alternative Fund used in our AssetMaxxSM and AssetMaxxGOSM  services were created by Ralph Doudera and our investment team to be held as a core investment. The Funds are active and constantly being managed to take advantage of market opportunities and safe guard from unnecessary risk.

Understanding Rebalancing

No matter what investment methodology you or your investment advisor choose, your portfolio mix is first defined by your risk tolerance, financial goals and age. Your portfolio mix could look like any one of the following:

  • 60% bonds and 40% equity
  • 50% bonds and 50% equity
  • 25% bonds, 50% equity, 25% alternatives
  • 100% equity
  • 100% bonds

Your allocation truly is personalized to you. Let’s say that your portfolio mix is 60% equity exposure and 40% bond exposure and that was your set allocation for the last 10 years. Over the last 10 years the equity market has greatly outperformed the bond market. Your 60% equity piece would have seen a lot of growth and if your account was not periodically rebalanced your equity exposure could look more like 80% and bond exposure 20%. The higher equity exposure has raised your risk compared to your original 60%/40% allocation. If the opposite happened and the equity market experienced extreme drawdowns while the bond market experienced growth over those 10 years, then going forward you would have less equity exposure and potentially miss out on making more profits as the equity market rallied (or went up). Rebalancing sets parameters on your portfolio and makes sure it stays correctly allocated until your investment objectives and goals change.

  • You have a 60% equity and 40% bond portfolio
  • After the equity market experienced a rally, your portfolio allocation is 68% equity and 32% bond
  • To rebalance your portfolio back to 60% equity and 40% bond, an 8% exchange would take place between the equity exposure and the bond exposure
  • 8% sell of equity exposure would be created and then once settled, 8% buy towards bond exposure would be created

Rebalancing can be set to any number of time periods: quarterly, annually, daily, monthly, etc. The motivation between rebalancing is to keep the same portfolio mix for the client throughout the desired time frame and to somewhat manage risk. Rebalancing, however does not safeguard against losses, bear markets, etc within each asset class (equities, bonds, alternatives , etc). For example, if your portfolio mix was 60% equities and 40% bonds during 2008, the rebalance parameters on your account were annual, and you chose to use index funds or mutual funds not actively managed, here is the loss you may have experienced using only the S&P 500 TR Index as your example of equity exposure and the Lipper High Yield Bond Index as your bond example (you cannot directly invest in an index).

  • $100,000 account is set to a 60% equity 40% bond allocation
  • In 2008, the S&P 500 TR Index experienced a loss of – 37.00 %
  • $60,000 (equity piece) would look like $37,800
  • In 2008, the Lipper High Yield Bond Index experienced a loss of –28.8%
  • $40,000 (bond piece) would look like $28,480
  • Total account value in 2008 would be $66,280
  • Total portfolio performance for 2008 would be – 33.72%, despite “rebalancing” only

Spectrum Financials’ Active Management

Active Management sets parameters on your portfolio and makes sure it stays correctly allocated until your investment objectives and goals change AND protects against extreme losses compared to its asset classes and benchmarks because of the actively managed mutual funds created by Ralph for Spectrum and Hundredfold.

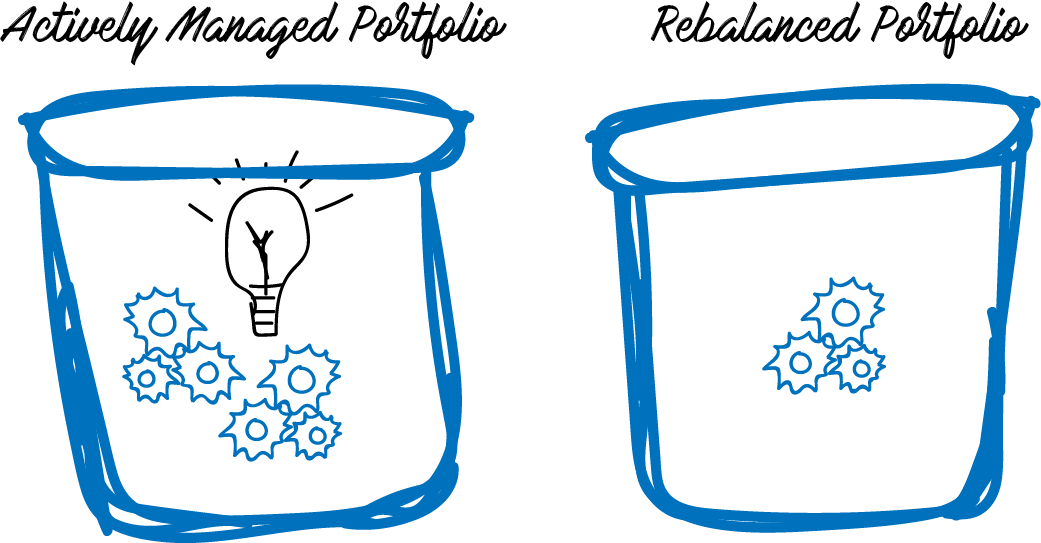
Below is an example of a portfolio using active management in tandem with rebalancing. For this example, 60% of the portfolio’s allocation will reflect an actively managed equity fund and 40% of the portfolio will reflect an actively managed fixed income fund. For more information and performance of these specific funds, please contact our office.

  • $100,000 account is set to a 60% actively managed equity 40% actively managed fixed income
  • In 2008, the actively managed equity fund was down –22.8%
  • $60,000 (equity piece) would look like $46,320
  • In 2008, the actively managed alternative fund experienced a loss of –12.24%
  • $40,000 (bond piece) would look like $35,104
  • Total account value in 2008 would be $81,424
  • Total portfolio performance for 2008 would have incurred less loss at –18.56% !

Using rebalancing and active management together could make your investment experience less volatile. Roller coasters are great for amusement parks but not your investments!

Spectrum and Hundredfold’s use of active management in their mutual funds asses the market on a daily basis and make investment decisions actively to both take advantage of market opportunities and to safeguard client’s assets.

Spectrum exists for one reason: to safeguard our client’s assets while attempting to make them money. We have been managing client assets for over 30 years through all sorts of market environments. Over those 30 years we continually prefect, learn and test the best methods to achieve our client’s goals. Rebalancing and Active Management are different, but when used together they can achieve more than one objective!

Spectrum’s Equity Fund Shines

Spectrum Advisors Preferred Fund (SAPEX) was launched three years ago and has acquired a 5-Star Morningstar Rating Overall and 5-Star Morningstar Rating for 3 years in its fund category, Multi Alternative, made up of 288 funds. (Morningstar disclosure below) This Fund was created for investors who want equity exposure in a fund that can also reduce risk. The goal of the fund is to outperform the equity market in both up and down markets. The research and portfolio construction of SAPEX has allowed this fund to receive its high rating and perform according to its objectives. Spectrum’s research found that understanding the equity market environment is important. The stock market has different personalities in different economic environments. Depending on the market environment, Bear, Bull or Transitional, the Fund will use different “play books”. These market environment types are defined by Spectrum’s investment and research team and are not the common media definitions. The play books have different analysis tools, asset types, speed of trades, and exposure ranges that allow the Fund to be dynamic and adaptive in changing environments.


The chart above illustrates the Fund’s exposure to both stocks and bonds since inception. It had an “up market capture” of 103% and a “down market capture” of 81.5% of its blended stock-bond benchmark. For the first 6 months of 2018, SAPEX had a gain of 6.76% and outperformed the S&P 500 TR Index by 4.11% and outperformed the NYSE Composite TR Index by 7.83%. (See full performance information and disclosures below)

By combining all these strategies into an overall portfolio, the investment team strives to do four things based on the market environment: (1) Select the best stock pickers. (2) Determine how much and what kind of equity exposure to have. (3) Implement bear market strategies to reduce risk in economic recessions. (4) Specific selection of bond and credit investments may be used to add additional return when appropriate. To learn more about SAPEX, please call our office at 757-463-7600 or visit TheSpectrumFunds.com.

The performance data quoted represents past performance. Past performance does not guarantee future results. Investment return and principal value will fluctuate, so that shares, when redeemed, may by worth more or less than their original cost. Current performance may be lower or higher than the performance data quoted and assumes the reimbursement of any dividend and/or capital gains distributions. To obtain performance data current to most recent month-end, please call toll free 1-888-572-8868.

Consider these risks before investing: Bond risk, derivatives risk, equity risk, inverse ETF risk, junk bond risk, leverage risk,
management risk, market risk, mutual fund and ETF risk, short position risk, small and medium capitalization risk, and turnover risk. There is no guarantee the fund will achieve its investment objective. You can lose money by investing in the fund. Please carefully review the prospectus for detailed information about these risks.

S&P TR 500 Index is a capitalization weighted index of 500 stocks representing all major domestic industry groups. The S&P 500 TR assumes the reinvestment of dividends and capital gains. It is not possible to directly invest in any index.

*60/40 NYSE Composite/Barclays U.S. AGG. Bond Index: This benchmark gives 60% weight to the NYSE Composite Index and 40% weight to the Barclays U.S. Agg. Bond Index. The NYSE Composite Index (NYA) measures the performance of all stocks listed on the New York Stock Exchange. It includes more than 1,900 stocks, of which over 1,500 are U.S. companies. Its breadth therefore makes it a much better indicator of market performance than narrow indexes that have far fewer components. The weights of the index constituents are calculated on the basis of their free-float market capitalization. The index itself is calculated on the basis of price return and total return, which includes dividends. The Barclays U.S. Aggregate
Bond Index measures the underlying index and performance of the total U.S. investment grade bond market. It is a market value-weighted index that tracks the daily price, coupon, pay-downs, and total return performance of fixed-rate, publicly placed, dollar-denominated, and non-convertible investment grade debt issues with at least $250 million per amount outstanding and with at least one year to final maturity.

Request a prospectus or a summary prospectus from your financial representative or by calling Gemini Fund Services at 855-582-8006 or access www.thespectrumfunds.com. These prospectuses include investment objectives, risks, fees, expenses, and other information that you should read and consider carefully before investing. Gemini Fund Services serves as transfer agent to the Fund and is not affiliated with the advisor, subadvisor or distributor.

*© 2018 Morningstar, Inc. All Rights Reserved. The information contained herein: (1) is proprietary to Morningstar; (2) may not be copied or distributed; and (3) is not warranted to be accurate, complete or timely. Neither Morningstar nor its content providers are responsible for any damages or losses arising from any use of this information. Past performance is no guarantee of future results. The Morningstar Rating TM for funds, or “star rating”, is calculated for managed products (including mutual funds, variable annuity and variable life subaccounts, exchange-traded funds, closed-end funds, and separate accounts) with at least a three-year history. Exchange-traded funds and open-ended mutual funds are considered a single population for comparative purposes. It is calculated based on a Morningstar Risk-Adjusted Return measure that accounts for variation in a managed product’s monthly excess performance, placing more emphasis on downward variations and rewarding consistent performance. The top 10% of products in each product category receive 5 stars, the next 22.5% receive 4 stars, the next 35% receive 3 stars, the next 22.5% receive 2 stars and the bottom 10% receive 1 star. The Overall Morningstar Rating for a managed product is derived from a weighted average of the performance figures associated with its three-, five- and ten-year (if applicable) Morningstar Rating metrics. The weights are: 100% three-year rating for 36-59 months of total returns, 60% five-year rating/40% three-year rating for 60-119 months of total returns, and 50% 10-year rating/30% five-year rating/20% three-year rating for 120 or more months of total returns. While the 10-year overall star rating formula seems to give the most weight to the 10-year period, the most recent three-year period actually has the greatest impact because it is included in all three rating periods.

Page 17 of 38

Spectrum Financial, Inc 2023