
GENERAL MARKET COMMENTARY
2015—The Year Nothing Worked. Since 1995, practically every year has seen some asset deliver returns exceeding 10%. Most investors were disappointed last year…from treasuries to high yield bonds, technology, internationals, emerging markets, or commodities. 2016 has started off on an even more disappointing note. Many famous hedge fund managers closed down their funds because their strategies had significant declines. Also, many investors redeemed their investments having thought that hedge funds always meant low risk.
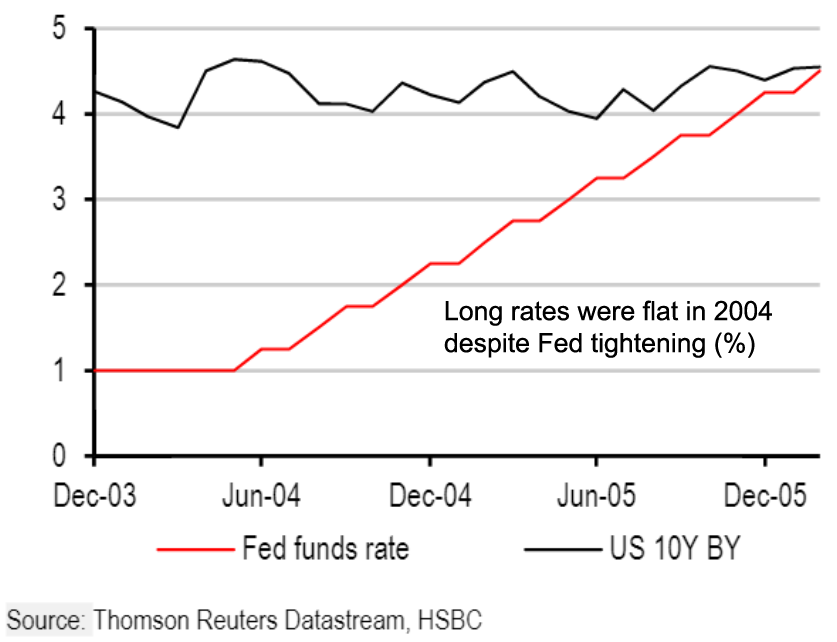
The recent rout in global stocks is being fueled by investors reducing leverage as the central bank runs out of options to prop up economies. While the US economy remains stable, overseas markets are not in good shape, with China, in particular, being very unsettled. The Federal Reserve did increase interest rates in December for the first time in nearly a decade, and historically, more increases are likely this year. That does not always mean long term interest rates will increase. The chart below left illustrates what happened in 2004.
Over the long term, interest rates are directly related to inflation rates. Interest rates (adjusted for inflation) can be seen since 1872 in the chart below right. Real rates were negative during extreme inflation and higher during periods of deflation. If inflation remains low, so will interest rates.

RECESSION, HIGH YIELD, AND STOCKS
According to Jeffrey Gundlach, co-founder of Doubleline Capital, the high yield bond market may be signaling a recession this year. He puts the probability at 33%, and Martin Fridson, a long-term analyst in high yield credit analysis, puts the probability at 44%.
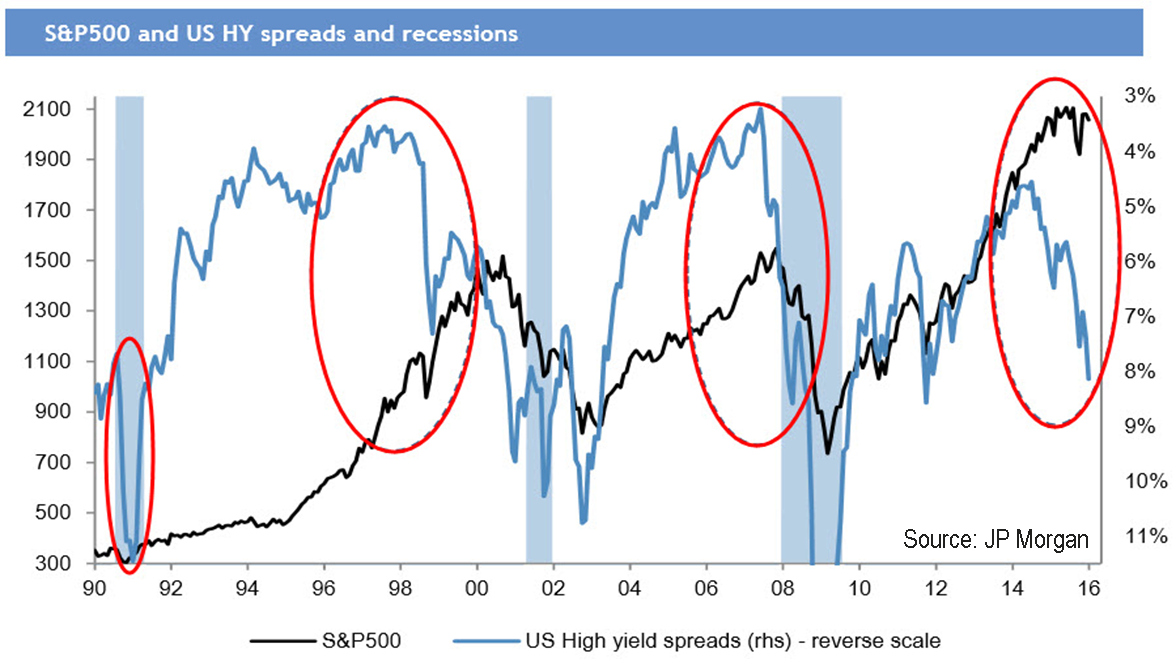
The accompanying chart above shows the correlation between stocks and high yield bonds. The indications are that stocks have to drop significantly lower to get back in sync with high yield credit. Of course, one can also interpret the chart to indicate that a recession is imminent.
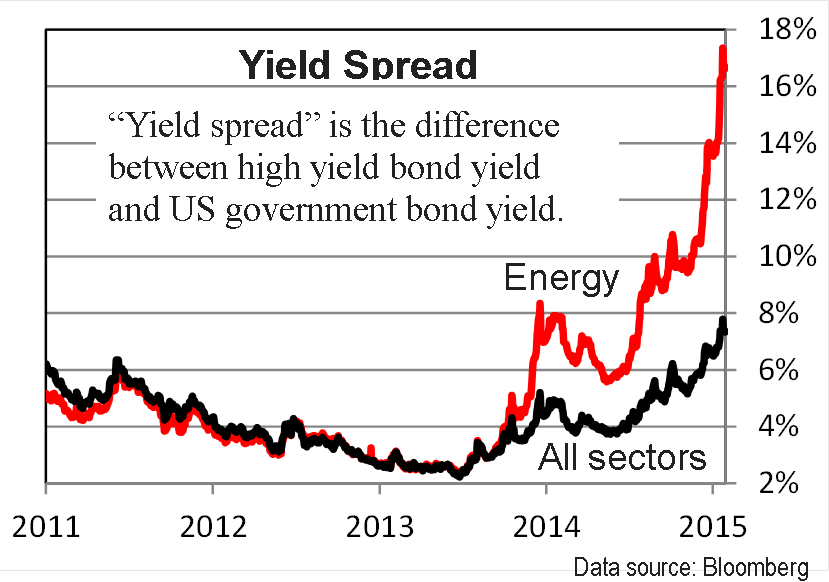
We have been trading high yield bonds for 30 years and have learned that there are times to be on the sidelines, and times to be invested. This is one of those times to be ready to take advantage of a meaningful rally. If a recession does come this year, the yield spread will get even better for investing and we will carefully monitor the markets to capitalize on this “once every decade” opportunity.
DYNAMIC & HIGH YIELD TRADING SIGNALS
These charts illustrate our recent actual trading signals for both our short-term Dynamic and intermediate-term High Yield Bond Strategies. As you can see, we attempted to let our profits run and cut short losses. These trading strategies continue to make a positive case for active management.
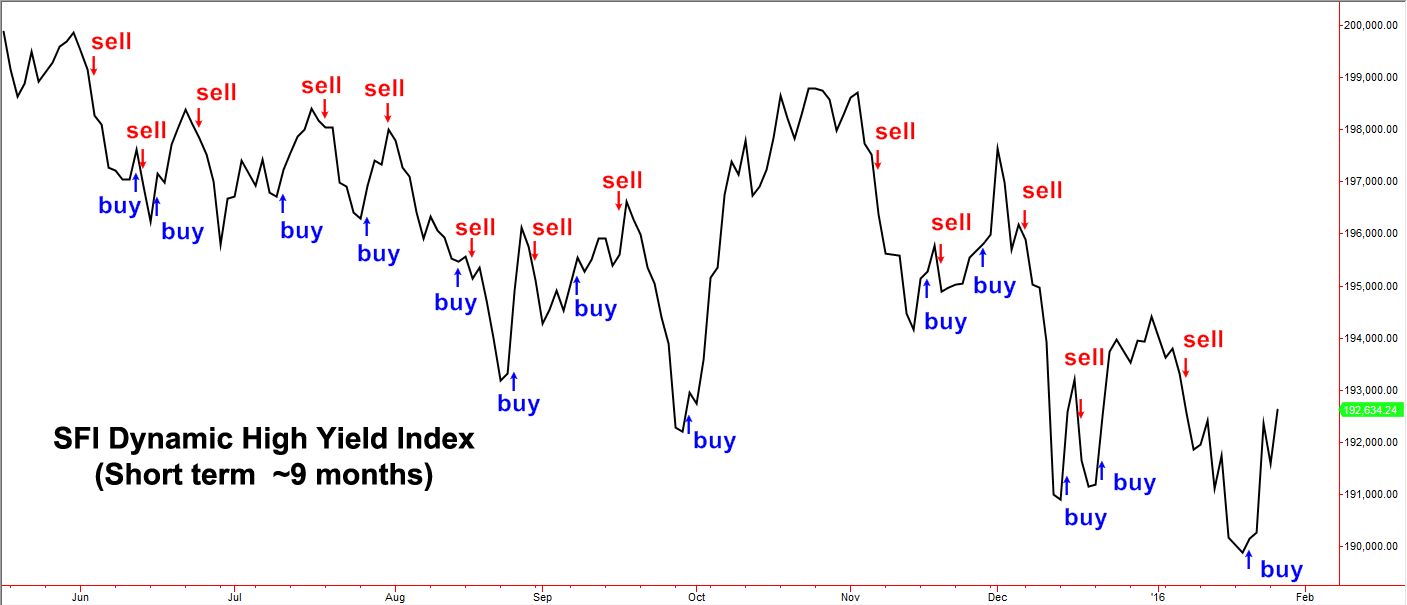
Created with TradeStation ©TradeStation Technologies, Inc. All rights reserved
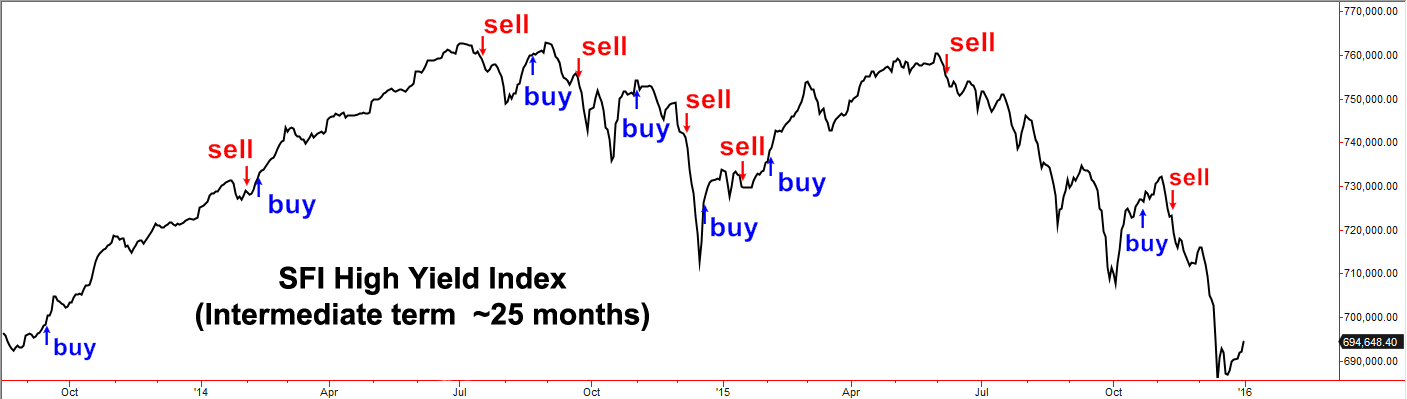
Created with TradeStation ©TradeStation Technologies, Inc. All rights reserved
The Dynamic Strategy (top chart) has no restriction on the number of trades, so it is more active. The High Yield Bond Strategy (lower chart) only generates about three buy signals per year. We are encouraged by the opportunity high yield bonds now offer, paying dividends of 7% more than government bonds. This offers profit potential that we have not seen in five years. When this happened in December 2011, the 1 year return of the High Yield Index was over 15%.
HIGH YIELD BOND OPPORTUNITY
High yield bonds have been in a downtrend for the past several months and this downtrend has accelerated along with the stock market in the past few weeks. The Merrill Lynch High Yield Master II Index is down over 12% from its May 2015 peak. That is the second worst decline in the 19-year history of this index. Only the 2008 meltdown was worse—and that produced a 57.5% rally.
There have been a number of reasons investors have fled the high yield bond market over the past year, including concerns over interest rates, energy and commodity exposure, liquidity, and defaults. With this sell-off, spreads have increased to multi-year highs, creating opportunity for investors like us to take advantage of the current environment (see chart below).
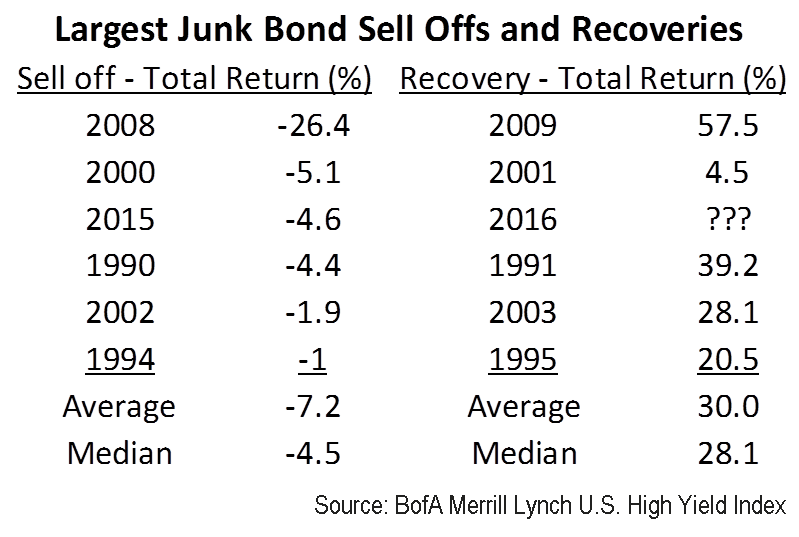
High yield bonds have never lost money for two consecutive years, so a full year of high yield bond losses in 2016 would be unprecedented, based on BofA Merrill Lynch U.S. High Yield Index data going back to 1987. Junk bonds have lost money in only six of the past 29 years—in 2015, the U.S. recessions of 1990, 2000 and 2008, the WorldCom bankruptcy in 2002, and during rate hikes by the Federal Reserve in 1994. In all prior cases, robust recoveries occurred in the year immediately after a year of losses (see table below).Our investors should be well rewarded as the yield spread returns to normal.
Disclosure
Spectrum Financial, Inc. is a Registered Investment Advisor. The Full Spectrum is published quarterly for its investors and account executives. This publication is not intended to offer or solicit investment advice, nor should anyone act upon any suggestions made herein, without individual counseling from your account executive regarding risks involved. There is no guarantee that the recommendations of management will prove to be as profitable in the future, as they have in the past. The information presented in this issue has been obtained from sources believed to be reliable, but its accuracy is not guaranteed. Due to various factors, including changing market conditions, the content may no longer be reflective of current opinions or positions. A copy of Spectrum’s current written disclosure statement discussing advisory services and fees is available upon request. All rights reserved, please notify when quoting.
This writing is for informational purposes only and does not constitute an offer to sell, a solicitation to buy, or a recommendation regarding any securities transaction, or as an offer to provide advisory or other services by Spectrum Financial, Inc. in any jurisdiction in which such offer, solicitation, purchase or sale would be unlawful under the securities laws of such jurisdiction. The information contained in this writing should not be construed as financial or investment advice on any subject matter. Spectrum Financial, Inc. expressly disclaims all liability in respect to actions taken based on any or all of the information on this writing. For full disclosure please see disclosures page here.