With my husband and I, and most of our friends, in our early to mid-thirties we all finally have some sort of investment accounts. Whether they are 401(k)s, Roths, joint savings accounts or IRA Rollovers we are all starting to take the shape of a grown-up. So instead of talking about whatever we used to talk about in our twenties at a dinner party, the new topic is investing (after the debate on vaccine mandates and when the Britney Spears documentary will come out). My greatest concern from these conversations is that it seems the majority of everyone’s portfolio is in some uber hot meme stock or crypto. Bottom line? New investors with their new life savings are as wide open to major risk as any of the wide receivers on the Cowboys offense (let’s not talk about the Broncos game). Don’t get me wrong, I traded some of that DWAC ‘spac’, have Shibu crypto in my Coinbase account, and am trying to hop on that hot uranium trade– but that’s our play money, not our serious money. Working in the financial industry over the last 10 years and with a firm that has managed money since 1986… I know what happens after bubbles burst, when major highs become major lows, and why black swans are less enjoyable than the movie. Knowing this is one thing, feeling it is another. Anyone that began investing after March 9, 2009 has never felt a true bear market. March 2020 was a major sell-off, but not a bear market. We, the blasted millennials, have never felt what a 50% loss in our major savings does to our psyche, goals, and children’s daycare funds. “Knowing” and “feeling” are completely different.
About two weeks ago I was having my coffee early in the morning before heading into the office. I had been mulling over some complex situations and remembered a book I bought called, “The Hard Thing About Hard Things: building a business when there are no easy answers” by Ben Horowitz. I plucked it right off the bookshelf and began reading. Ben is considered one of Silicon Valley’s most respected and experienced entrepreneurs, and early on in his book he talked about the beginnings of his first startup as the CEO of LoudCloud when the dot-com bubble burst:
“…It seemed like we were building the greatest business of all time. Then came the great dot-com crash. The NASDAQ peaked at 5,048.62 on March 10, 2000—more than double its value from the year before—and then fell by 10 percent ten days later. A Barron’s cover story titled “Burning Up” predicted what was to come. By April, after the government declared Microsoft a monopoly, the index plummeted even further. Startups lost massive value, investors lost massive wealth, and dot-coms, once heralded as the harbinger of a new economy, went out of business almost overnight and become know as dot-bombs. The NASDAQ eventually fell below 1,200, an 80% percent drop from its peak.”
I immediately thought, “Gosh this seems familiar.” There is investor euphoria with investors willing to take massive risk just to get a piece of the pie. There are people investing in a crypto that is not tied to anything, with founders admitting it was created as a joke! The global economy is fragile as it reels from a global pandemic, inflation is here (whether the Fed wants to call it transitory or not), international tensions are high (yep, that didn’t go away), businesses can’t find employees and supply chains are tighter than a Skims bodysuit. The chart to the right was used in our most recent quarterly newsletter, The Full Spectrum. 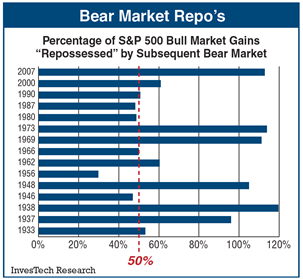 This chart shows that almost every bear market over the past 88 years has taken back, or repossessed, about 50% of the previous bull market gain. Robert Harmon, who oversees Spectrum’s retail clients’ portfolios, put the current state of the market in the best word picture. He said, “It’s like there is a bear market puzzle and once it is all put together, things are going to get nasty. And as it stands, there are only a couple pieces missing.” It just doesn’t seem like the time to play Russian roulette with all your savings. There are more intelligent ways to invest your hard-earned assets.
Every investor is different because every person has a different risk tolerance, need for security and goal for a certain investment account. My plea is to assess what you can truly stand to lose, because it can be truly lost. When you invest any assets, you are taking on risk. That is the deal of investing. This industry is heavily regulated and on every marketing piece (including this one!) there will be a myriad of disclosures at the bottom. One may read, “Past performance is not indicative of future results” and/or “Investments can fluctuate”. When you begin investing, and you’ve only seen (mostly) gains and have (mostly) been rewarded for the risk you took, you get a false sense of surety and security. At Spectrum, we believe that as an investor you don’t have to take unnecessary risk to be compensated, and I agree whole heartedly. Separate out your serious money from your play money. There is nothing wrong with wanting to participate in something fun and risky, or what the investment world calls, “speculative”. I just try and keep that to 5% of my portfolio. The other 95%? I have in actively managed mutual funds. Taking on risk is not a bad thing. As the saying goes, “the greater the risk, the greater the reward”. I can afford to take on greater risk in retirement accounts because the “life” of that money is longer than the “life” of the joint savings account that may be used for an additional down payment on our next home in 2 years. The sooner you need the money, the less risk you should take with it.
There is a saying that “Ignorance is bliss.” Ignorance in investing is not bliss, it can be extremely painful. I will end with an excerpt from the book Greenlights written by the wisest man on earth, Matthew McConaughey:
“Everybody likes to be in the know. Even when we lose two and win one, we believe the one more than the two. We believe the one winner we picked was a product of our truer selves, was when we met our potential and read the future, was when we were gods. The two losses, however, were aberrations, misfits, glitches in our masterminds, even though the math clearly makes them the majority. After the game is played, everybody kn-ewww who the winner would be. Everybody is lying. Nobody kn-owwws who’s going to win or cover the bet, there is no sure thing, that’s why it’s called a bet. There’s a reason Vegas and Reno continue to grow. They kn-owww we bettors love to believe we do. That is a lock.”
Spectrum has been actively managing client assets since 1986, call our Investor Services team today to discuss how our mutual funds can compliment your portfolio.