Active portfolio management is not a new concept but tends to be more mysterious to investors regarding what the wizards do behind the curtain. Even if it is not used exclusively, technical analysis tends to play a greater role in active management as compared to fundamental analysis. Prior blog posts have covered some of the differences between the two. Today we will be running through a rather quick history lesson about technical analysis including the evolution and role of indicators. As the tools of the trade are understood, the fog of mystery should begin to disperse.
Technical analysis did not have one specific starting point. The benefits of plotting prices for the sake of extracting clues of future direction occurred in the 1600’s as lottery prices were plotted in England. Accounts by Joseph de la Vega reported prices in the Dutch markets also in the 1600’s and Homma Munehisa of the rice markets in 17th century Japan.
 Bank of London
In the U.S., Charles H. Dow created his famous index to visualize the collective changes in a group of industrial companies. In the early 1900’s, traders and authors such as Richard Schabacker, Harold Gartley, William Gann, R.N. Elliot, and Richard Wyckoff developed and published methods to interpret the price action of stocks and commodities. “Technical Analysis of Stock Trends” by Edwards and Magee, is commonly cited as the most comprehensive book on early technical analysis. Most of these works center around identification and interpretation of trends, price patterns, and volume analysis. This was the era in which concepts such as, Head and Shoulders tops and bottoms, double tops and bottoms, triangles, support and resistance, and trend lines were introduced.
Fast forward to the late 1960’s and early 1970’s, which brings us to the early stages of the meat of our topic – indicators. In 1969, Sherman McClellan and his mathematician wife Marian developed the oscillator and summation bearing their last name. Amazingly, the complex math was calculated daily, originally by hand, prior to the aid of computers.
One of my life’s greatest thrills was eating lunch at a Taco Bell with Mr. McClellan many years ago, but that’s a story for another time.
In 1978, J. Welles Wilder Jr. published, “New Concepts in Technical Trading Systems”. Similar to the McClellan indicators, Wilder’s indicators were described to readers exactly how to calculate by hand the formulas behind indicators using daily worksheets. Wilder’s book introduced indicators such as the Relative Strength Index (RSI), Directional Movement (ADX and DMI), Parabolic SAR, Average True Range (ATR), and others. These indicators are early examples of going beyond looking at basic price action. In other words, math formulas were introduced that can create plots on the same page or chart as the price action to serve as a companion to the traditional forms of price and volume analysis.
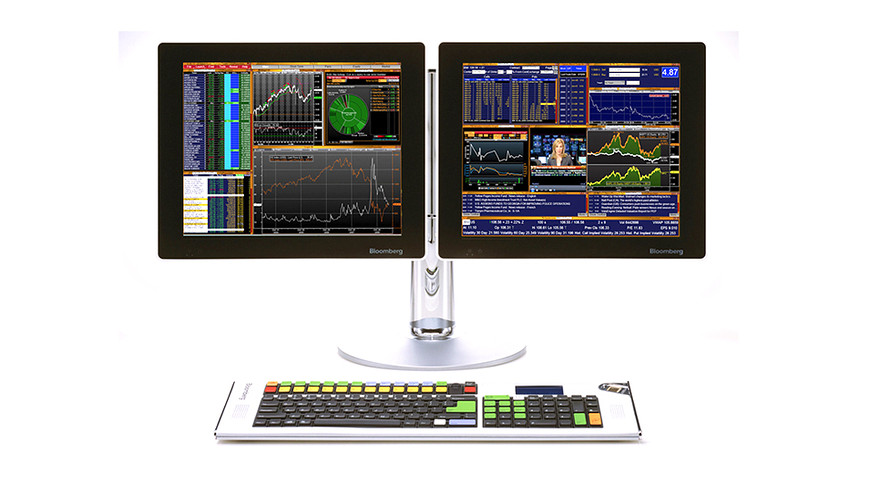
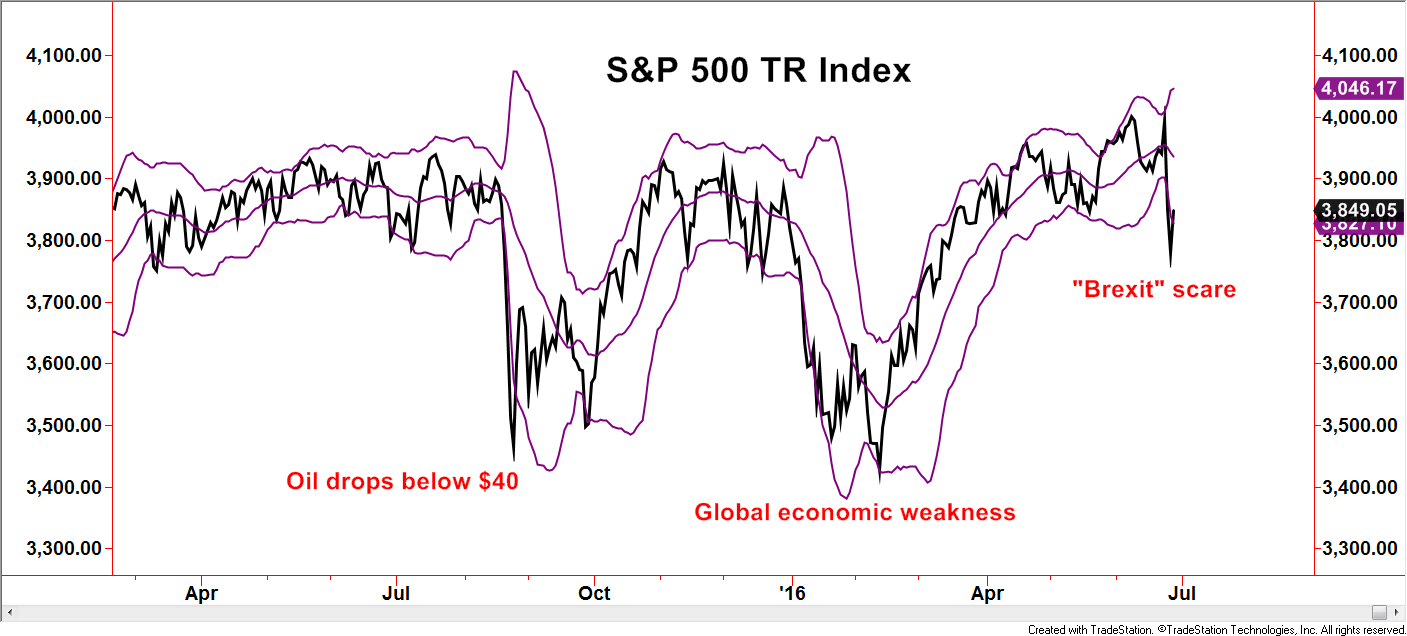
 Example of early charting software displaying candlesticks
As a brief but important aside, 1970 was the beginning of the Market Technicians Association (MTA). This organization was established by a group of professional technical analysts that sought to raise the level of acceptance of the craft to beyond what had been deemed by many as a “voodoo” form of analysis. Many of the MTA members are well-known, having extensive authorship and media appearances regarding chart-based methods. In 1949, the Securities and Exchange Commission displayed a strong bias against chart-based methods when the organization stated “all Wall Street research must be rooted in sound fundamental principles”. Through ongoing efforts by the MTA, in 2005, the Securities and Exchange Commission amended Rule 344. “There are officially two different categories of Wall Street research analysts: a fundamental analyst follows companies and has a CFA diploma; a technical analyst follows stocks and has a CMT diploma”.
In the decades that followed, computers and technology have played significant roles in the expansion of technical analysis and its impact to portfolio management. Already mentioned were trailblazers such as the McClellans and J. Welles Wilder Jr., but many others developed indicators that received notoriety. An indicator by Dick Arms was seen scrolling along the tickers on the financial programs noted as the TRIN or Trading Index, though many call the indicator the Arms Index in honor of the originator. Joe Granville’s On Balance Volume, John Bollinger’s Bollinger Bands, Gerald Appel’s Moving Average Convergence Divergence (MACD), and many others became staples among chartists as early versions of charting software incorporated these tools.
 Indicators can fit into various categories and similar to a chef reaching for specific ingredients, can be combined and incorporated with different weightings in order for a portfolio to take on a particular flavor or have a particular personality. Low volatility funds may use specific indicators while aggressive portfolios may choose to use others. In future blogs, we will take a look at these different categories, covering some indicator examples and why a portfolio manager may or may not use them in the recipe.
So why spend time with the history lesson? A building’s foundation must be strong in order for it to stand the tests of time. Before the building blocks form the foundation, architects, engineers, and contractors must understand the nature of the building materials and how they work together for the common goal. If we want to understand how a portfolio is constructed and managed, we have to establish a basis upon why portfolio management has confidence in the methods. From a broader sense, some chart-based analysis used by portfolio managers may be relatively simple but many can be very complex, based on decades of supporting research and development by many wizards of the craft.
Disclosures
This writing is for informational purposes only and does not constitute an offer to sell, a solicitation to buy, or a recommendation regarding any securities transaction, or as an offer to provide advisory or other services by Spectrum Financial, Inc. in any jurisdiction in which such offer, solicitation, purchase or sale would be unlawful under the securities laws of such jurisdiction. The information contained in this writing should not be construed as financial or investment advice on any subject matter. Spectrum Financial, Inc. expressly disclaims all liability in respect to actions taken based on any or all of the information on this writing. For full disclosure please see disclosures page here.
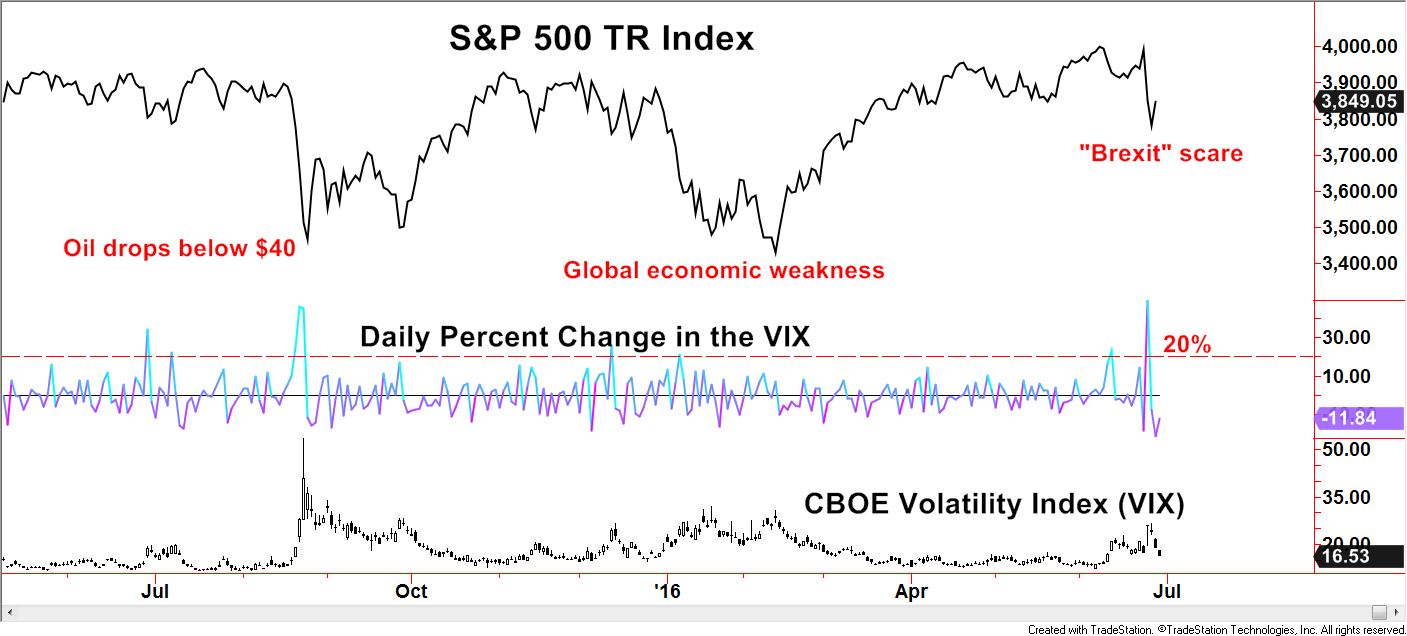
 Created with TradeStation © TradeStation Technologies, Inc. All rights reserved