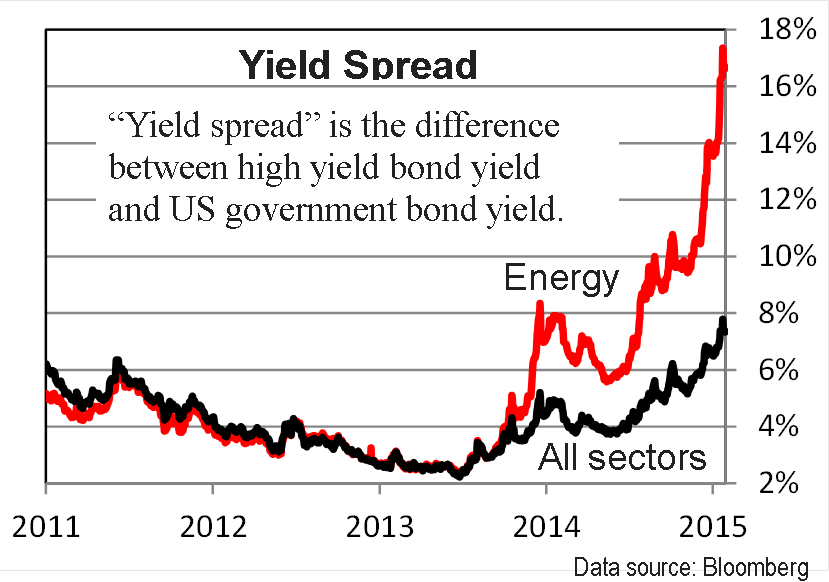
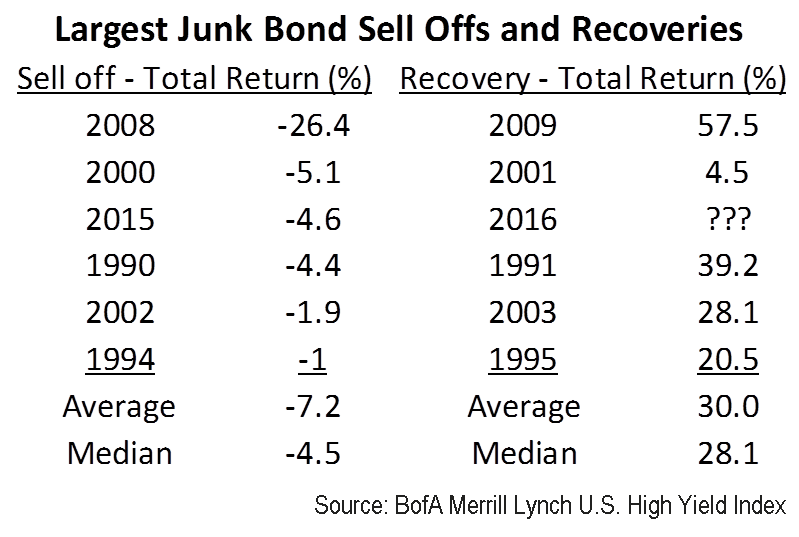
The “negative feedback loop” was a popular topic in January, which ultimately led to pessimistic sentiment extremes. Buying and selling fueled by emotion tends to be reversed at some point and typically done so by way of sharp counter-moves. That was seen in the equity and bond markets in February. Oil played a key role in the market’s weakness so it is no surprise it has helped in the improvements in February. The price of oil touched a new low in February and closed the month still below levels seen in late January, but the marginal rebound late in the month has acted as a positive domino effect to other areas such as high yield bonds, foreign markets and domestic equities, especially small-caps. Most of these growth-oriented asset classes would be considered in major downtrends, which increases the importance of disciplined buy and sell methodologies of investment strategies over a general assessment of a bullish or bearish outlook.
Spectrum’s SecurityMaxx Strategies – An Inside Look
HIGH YIELD BOND: The improved momentum in the high yield market warranted a shift to an invested stance at the end of the month
LEVERAGED HIGH YIELD BOND: The Leveraged High Yield Strategy became invested at the end of the month for non-leveraged, core positions.
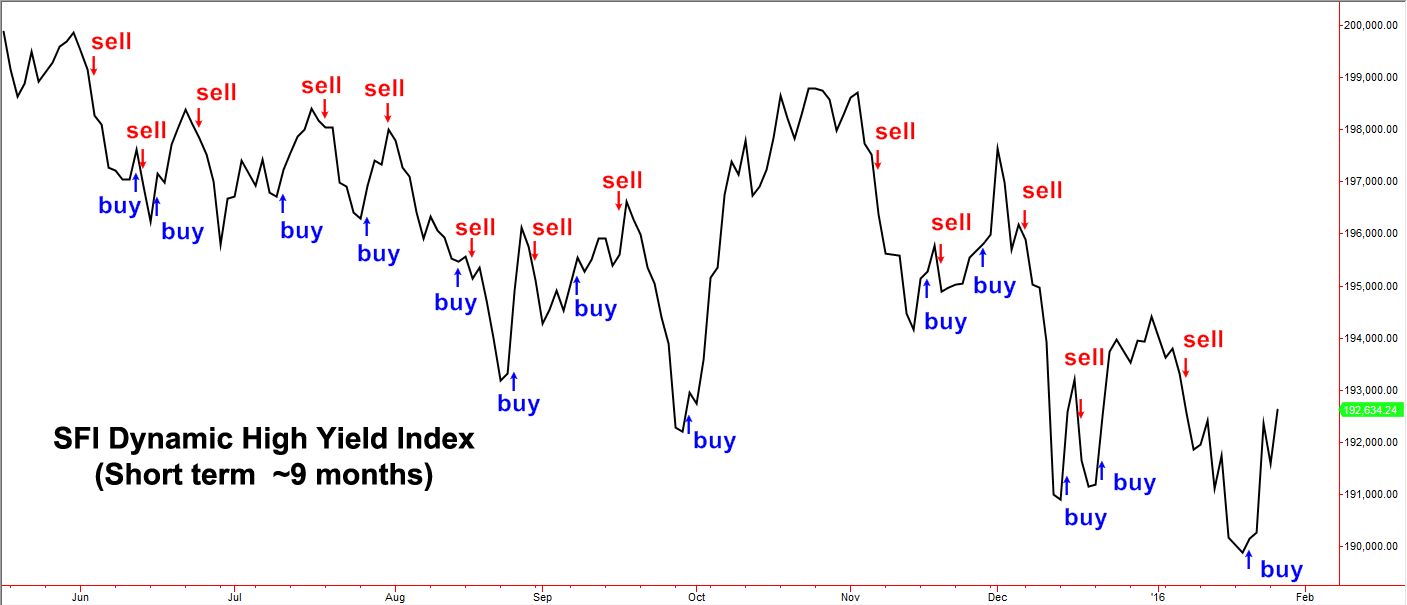
DYNAMIC HIGH YIELD: The sell-off and bottoming attempt in the high yield market allowed for several trades in this nimble strategy.
INTERNATIONAL SECTOR: Equity exposure was defensive during the month. Core funds were hedged early in the month but partially removed in the latter part of the month. Positions in the domestic equity market were reduced relative to foreign market exposure as foreign equities gained traction.
CORE FOCUS: The Major Trend Index (MTI) remained negative throughout February despite the mid-month upturn in stock prices. The negatives in the sentiment and valuation categories of the MTI offset the gains in the technical categories preventing the MTI from moving into the neutral zone. Core maintained a 43% allocation to stocks, a level well above the more typical allocation when MTI is negative of 30%. High yield bonds are sporting an 8% yield and have turned up in price offering a potential opportunity to deploy the 30% cash position.
LONG SHORT SECTOR: This strategy had an average net exposure of a little under 19% for the month. Its low volatility character comes from combining trending sectors and style-based investments with hedging techniques. Characteristics of the stock market continued to warrant a more defensive stance. This includes shying away from narrow sub-sector choices that tend to have higher volatility than broader-based sectors and indexes.
| BENCHMARK PERFORMANCE | TOTAL RETURN | TOTAL RETURN |
| Feb | YTD | |
| BARCLAYS U.S. HIGH YIELD VLI INDEX | 0.80% | -0.75% |
| All US Domestic Equity Funds (Avg. US Stock Fund) | -0.15% | -6.36% |
| NASDAQ COMPOSITE | -1.02% | -8.76% |
| S&P 500 TR Index (w/ dividends) | -0.13% | -5.09% |
| MSCI ALL COUNTRY WORLD INDEX | -0.63% | -6.59% |
This report is meant for distribution to financial professionals only. Its primary intent was for internal use by Spectrum Financial, Inc., its staff, current representatives and other financial professionals. This report is not written as a guide for anyone to use in their own investment management.
Barclays US High Yield Very Liquid Index includes publicly issued U.S. dollar denominated non-investment grade, fixed-rate taxable corporate bonds that have a remaining maturity of at least one year, regardless of optionality.
Standard and Poor’s 500 TR Index (S&P500) is a capitalization-weighted index of 500 stocks representing all major industries.
NASDAQ Composite Index is a broad-based capitalization-weighted index of stocks in all three NASDAQ tiers: Global Select, Global Market, and Capital Market.
All US Domestic Equity Funds: Is an arithmetic average of all US Domestic Equity Mutual Funds, provided monthly by the Wall Street Journal
MSCI All Country World Index (MXWD) is a capitalization weighted index that monitors the performance of stocks from around the world.
Major Trend Index (MTI, developed by The Leuthold Group LLC) is designed to recognize major market trends rather than intermediate moves, combining over 180 individual components to assess the overall health of the stock market. It includes Intrinsic Value Indicators, Supply/Demand Tools, Market Action Tools, Attitudinal Gauges, and Economic/Interest Rates/Inflation Measures. Revisions and weighting adjustments are made from time to time.
FOR FINANCIAL PROFESSIONAL USE ONLY


