Tag: trend lines Page 1 of 2

A Beginner’s Guide to Buy Low, Sell High

A Beginners Guide to Buy Low, Sell High

 “Buy low, and sell high”, is foundational advice often given to beginning investors in order to avoid losses and lock in gains.  In an attempt to reach that goal, a portfolio manager often draws from the discipline of technical analysis which at its core, focuses on the effects of buying and selling pressures on assets such as stocks, bonds and commodities.  Technical analysis is often contrasted against fundamental analysis which focuses on gauging the financial health of a specific company or industry.  The two can also be blended, introducing an additional discipline, economic analysis.  This post will explore the technical analysis discipline which is diverse.  However, most technical analysis tools can be separated into either trend following or mean reversion categories. 

Understanding how markets move

Markets have two states of movement, either trending up/down or rangebound. A portfolio manager must first use indicators specific to identifying the two states of movement. Think of these technical analysis indicators as tools. Having the right tools for the job plays a significant role in the success of the overall investment process.  Like using a hammer to drive a nail or a shovel to dig a hole versus using the shovel to drive a nail and the hammer to dig a hole.  Once an environment is identified, more specific indicators and methods can be used which may reveal further information about the environment.

Indicators of market movements

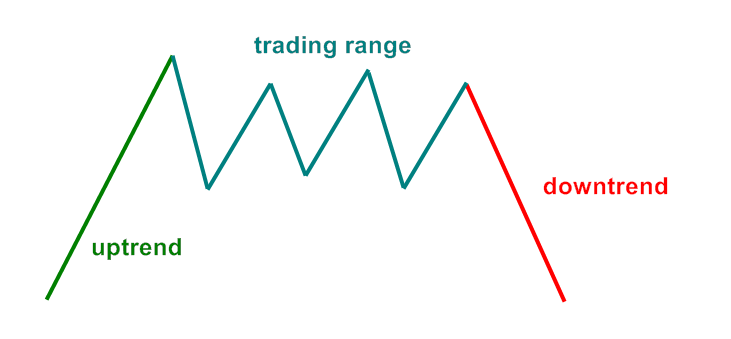
Indicators are available to detect various traits of price movement.  If “Point Z” is higher than “Point A”, then an uptrend may be present (though what happened in between could play a role in the investment decision).  Trends may be steady or could be choppy.  Even within a choppy uptrend, it may have various degrees of width in the swings.  Indicators exist that simply define a trend as being positive or negative and tools exist that define the level of volatility within the trend.  Rate of change indicators can identify the percentage movement over a specified time period in order to identify trend.  These indicators also display momentum or if the trend is speeding up or slowing down. Why does all this information matter? The more informed you are as to what is going on with a market environment the better equipped you may be to make risk-adjusted decisions for your portfolio.

Moving Averages

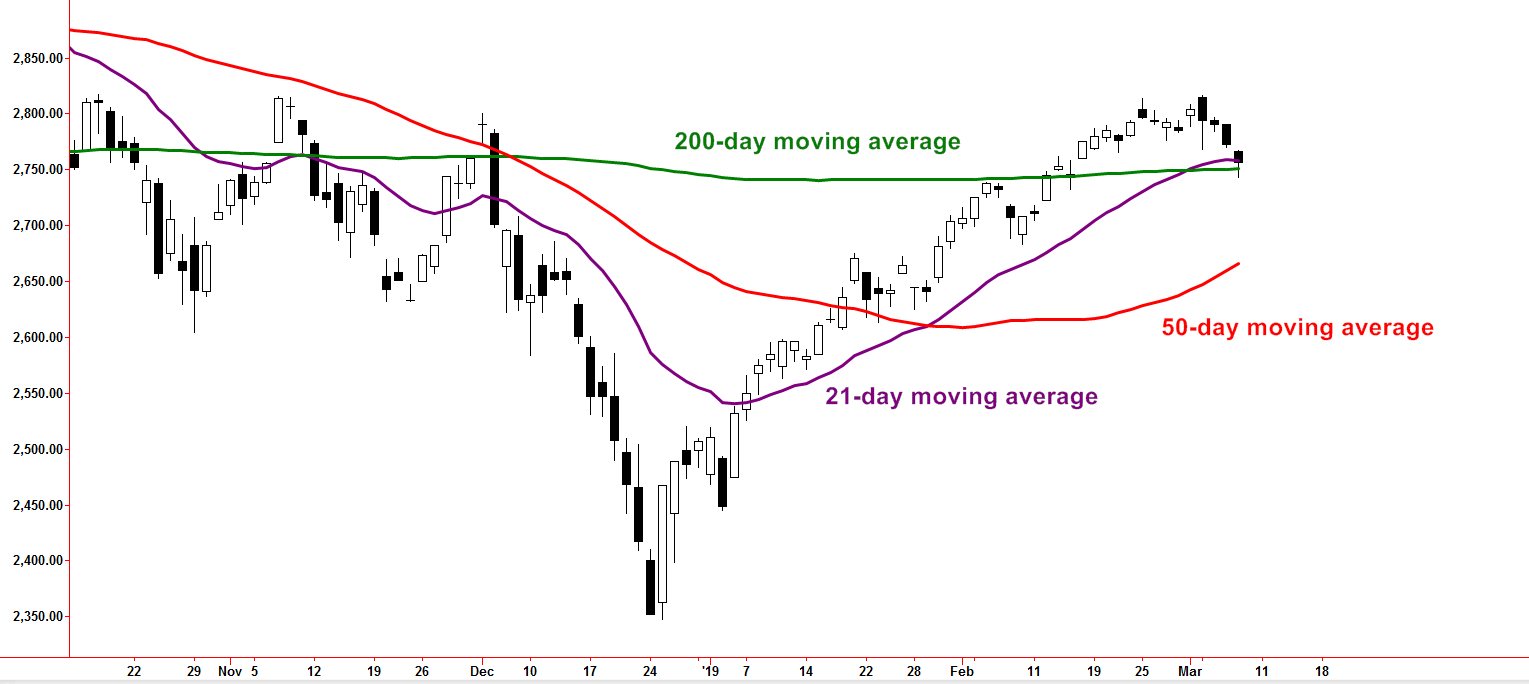
Moving averages (displayed below) are popular ways to identify trends because chart readers can easily see if the asset is above the moving average or below. If the asset is above the moving average the trend can be defined as an “uptrend”.  If the asset is below, it can be labeled as a downtrend.  The number of days used to calculate the moving average can vary in order to detect trends of various time frames such as shorter-term, intermediate or longer-term.

200 day
Created with TradeStation. © TradeStation Technologies, Inc. All rights reserved

Mean Reversion

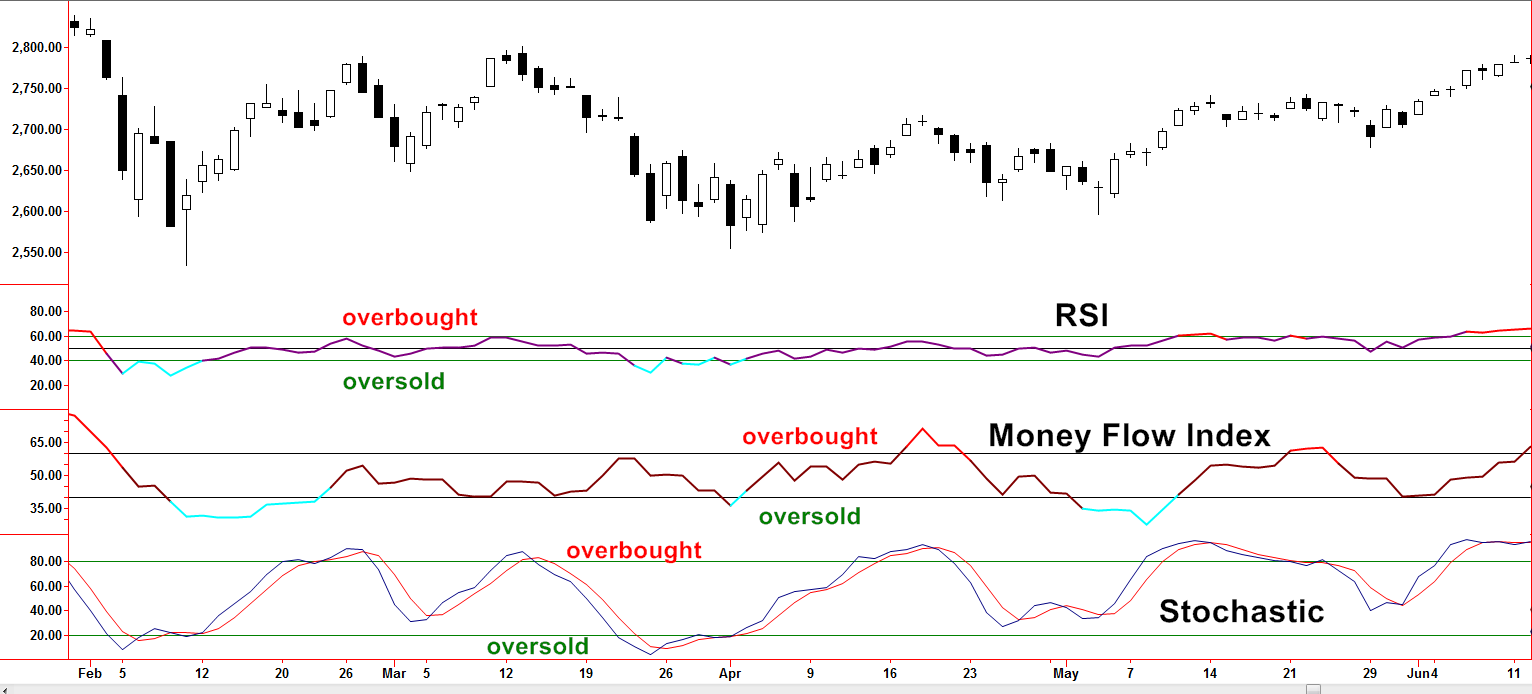
The “buy low and sell high” concept can also be conveyed through mean reversion methods.  In case that term is new to you, mean reversion simply means the movement is stretched, gone further than it typically does, and may soon snap back.  “Overbought” and “oversold” are common terms associated with mean reversion methods.  If a stock is in a trading range, by definition, it reaches an upper point, or extreme and then goes down toward a mean or average.  It may then overshoot and go to a lower extreme, becoming oversold and then revert back higher.  This process may be repeated numerous times.  Trading ranges may be after an uptrend or downtrend has slowed.  These may lead to a full reversal in overall direction or the trend may eventually resume but at a different slope.  Once a trading range is identified, a portfolio manager must then be able to identify what constitutes the extremes or overbought and oversold zones.  Tools of the trade may include Stochastics, Money Flow Index, and RSI, among others (pictured below).

RSI Money Flow
Created with TradeStation. © TradeStation Technologies, Inc. All rights reserved

Volatility Analysis

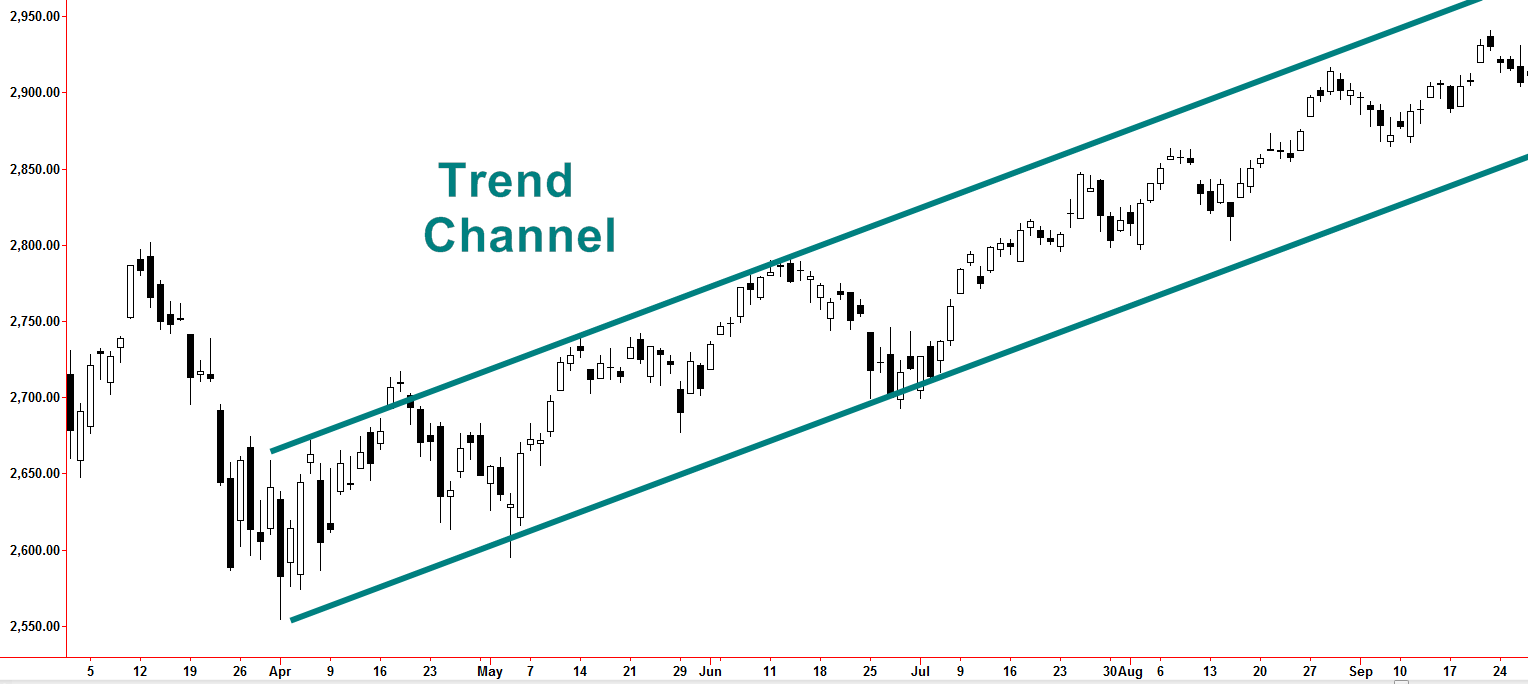
Tying the states of trending and trading ranges together may also involve volatility analysis.  If volatility is high enough a trend may be observed and at the same time, upper and lower extremes can too.  These are often referred to as trend channels (see below).  Modest adjustments to exposure are often the goal when trend channels are identified such as the adding of positions around the lower channel line or “profit-taking” near the upper channel line. 

Trend Channel
Created with TradeStation. © TradeStation Technologies, Inc. All rights reserved

Why does this matter?

Many investors take a hands-off approach to investing but that puts hard-earned money at the whims of the changing trends, and some bear market trends can be devastating.  Active portfolio management, by way of technical analysis, often includes implementation of the tools discussed above. These tools detect periods of trending or trading ranges.  Refinements with more specific trading tools and methods within those periods can further increase odds of potential success in navigating the unknown waters yet to be seen. This comprehensive approach to investing is used in Spectrum’s management for its clients.

Intro to Indicators – A look behind the curtain

Active portfolio management is not a new concept but tends to be more mysterious to investors regarding what the wizards do behind the curtain. Even if it is not used exclusively, technical analysis tends to play a greater role in active management as compared to fundamental analysis.  Prior blog posts have covered some of the differences between the two.  Today we will be running through a rather quick history lesson about technical analysis including the evolution and role of indicators.  As the tools of the trade are understood, the fog of mystery should begin to disperse.

Technical analysis did not have one specific starting point. The benefits of plotting prices for the sake of extracting clues of future direction occurred in the 1600’s as lottery prices were plotted in England.  Accounts by Joseph de la Vega reported prices in the Dutch markets also in the 1600’s and Homma Munehisa of the rice markets in 17th century Japan.

bank-englandBank of London

In the U.S., Charles H. Dow created his famous index to visualize the collective changes in a group of industrial companies.  In the early 1900’s, traders and authors such as Richard Schabacker, Harold Gartley, William Gann, R.N. Elliot, and Richard Wyckoff developed and published methods to interpret the price action of stocks and commodities.  “Technical Analysis of Stock Trends” by Edwards and Magee, is commonly cited as the most comprehensive book on early technical analysis.  Most of these works center around identification and interpretation of trends, price patterns, and volume analysis.  This was the era in which concepts such as, Head and Shoulders tops and bottoms, double tops and bottoms, triangles, support and resistance, and trend lines were introduced.

Fast forward to the late 1960’s and early 1970’s, which brings us to the early stages of the meat of our topic – indicators. In 1969, Sherman McClellan and his mathematician wife Marian developed the oscillator and summation bearing their last name.  Amazingly, the complex math was calculated daily, originally by hand, prior to the aid of computers.

 One of my life’s greatest thrills was eating lunch at a Taco Bell with Mr. McClellan many years ago, but that’s a story for another time.

In 1978, J. Welles Wilder Jr. published, “New Concepts in Technical Trading Systems”.  Similar to the McClellan indicators, Wilder’s indicators were described to readers exactly how to calculate by hand the formulas behind indicators using daily worksheets.  Wilder’s book introduced indicators such as the Relative Strength Index (RSI), Directional Movement (ADX and DMI), Parabolic SAR, Average True Range (ATR), and others.  These indicators are early examples of going beyond looking at basic price action.  In other words, math formulas were introduced that can create plots on the same page or chart as the price action to serve as a companion to the traditional forms of price and volume analysis.

red-green-candle-pricesExample of early charting software displaying candlesticks

As a brief but important aside, 1970 was the beginning of the Market Technicians Association (MTA). This organization was established by a group of professional technical analysts that sought to raise the level of acceptance of the craft to beyond what had been deemed by many as a “voodoo” form of analysis.  Many of the MTA members are well-known, having extensive authorship and media appearances regarding chart-based methods.  In 1949, the Securities and Exchange Commission displayed a strong bias against chart-based methods when the organization stated “all Wall Street research must be rooted in sound fundamental principles”.  Through ongoing efforts by the MTA, in 2005, the Securities and Exchange Commission amended Rule 344.  “There are officially two different categories of Wall Street research analysts: a fundamental analyst follows companies and has a CFA diploma; a technical analyst follows stocks and has a CMT diploma”.

In the decades that followed, computers and technology have played significant roles in the expansion of technical analysis and its impact to portfolio management. Already mentioned were trailblazers such as the McClellans and J. Welles Wilder Jr., but many others developed indicators that received notoriety.  An indicator by Dick Arms was seen scrolling along the tickers on the financial programs noted as the TRIN or Trading Index, though many call the indicator the Arms Index in honor of the originator.  Joe Granville’s On Balance Volume, John Bollinger’s Bollinger Bands, Gerald Appel’s Moving Average Convergence Divergence (MACD), and many others became staples among chartists as early versions of charting software incorporated these tools.

bloomberg-terminalsIndicators can fit into various categories and similar to a chef reaching for specific ingredients, can be combined and incorporated with different weightings in order for a portfolio to take on a particular flavor or have a particular personality. Low volatility funds may use specific indicators while aggressive portfolios may choose to use others.  In future blogs, we will take a look at these different categories, covering some indicator examples and why a portfolio manager may or may not use them in the recipe.

So why spend time with the history lesson? A building’s foundation must be strong in order for it to stand the tests of time.  Before the building blocks form the foundation, architects, engineers, and contractors must understand the nature of the building materials and how they work together for the common goal.  If we want to understand how a portfolio is constructed and managed, we have to establish a basis upon why portfolio management has confidence in the methods.  From a broader sense, some chart-based analysis used by portfolio managers may be relatively simple but many can be very complex, based on decades of supporting research and development by many wizards of the craft.

Disclosures

This writing is for informational purposes only and does not constitute an offer to sell, a solicitation to buy, or a recommendation regarding any securities transaction, or as an offer to provide advisory or other services by Spectrum Financial, Inc. in any jurisdiction in which such offer, solicitation, purchase or sale would be unlawful under the securities laws of such jurisdiction. The information contained in this writing should not be construed as financial or investment advice on any subject matter. Spectrum Financial, Inc. expressly disclaims all liability in respect to actions taken based on any or all of the information on this writing.  For full disclosure please see disclosures page here.

Page 1 of 2

Spectrum Financial, Inc 2023