Blogs about the coronavirus are dominating digital media and for good reason. The virus is clearly impacting us at a quickening pace. A clear impact is fear. Case numbers and death tolls are shown on television and internet news seemingly all throughout the day. Fear manifests itself in many ways. Early signs have been through decreased travel, primarily air flight and cruise ships. We are starting to see public gatherings such as sporting events being canceled or modified.
Fear, no matter what the source, plays an important role in the financial markets.
As we step back and gather clues, a logical path would be to look at what the financial markets did during prior times when there were threats of a worldwide pandemic.
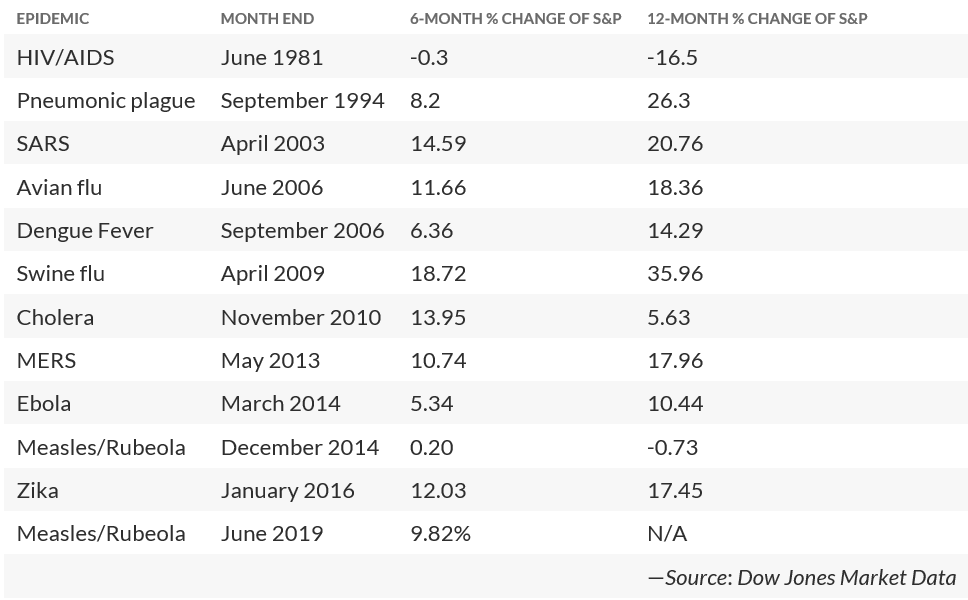
Over the last few weeks, I have seen information like this in table and chart form (see below). This information may give some degree of comfort, implying the historical tendency suggests very high odds of a gain in the intermediate term. But what about the time in between day 0 and the six months out?
 Markets have experienced unprecedented movements that have not been seen but just a few times in the last 100 years. Is it logical to embrace the indication from a table or similar statistics of prior outbreaks?
Not just quantify it but to gauge its movement. The point is to move beyond interpretation of headlines and to focus more on interpreting human behavior.
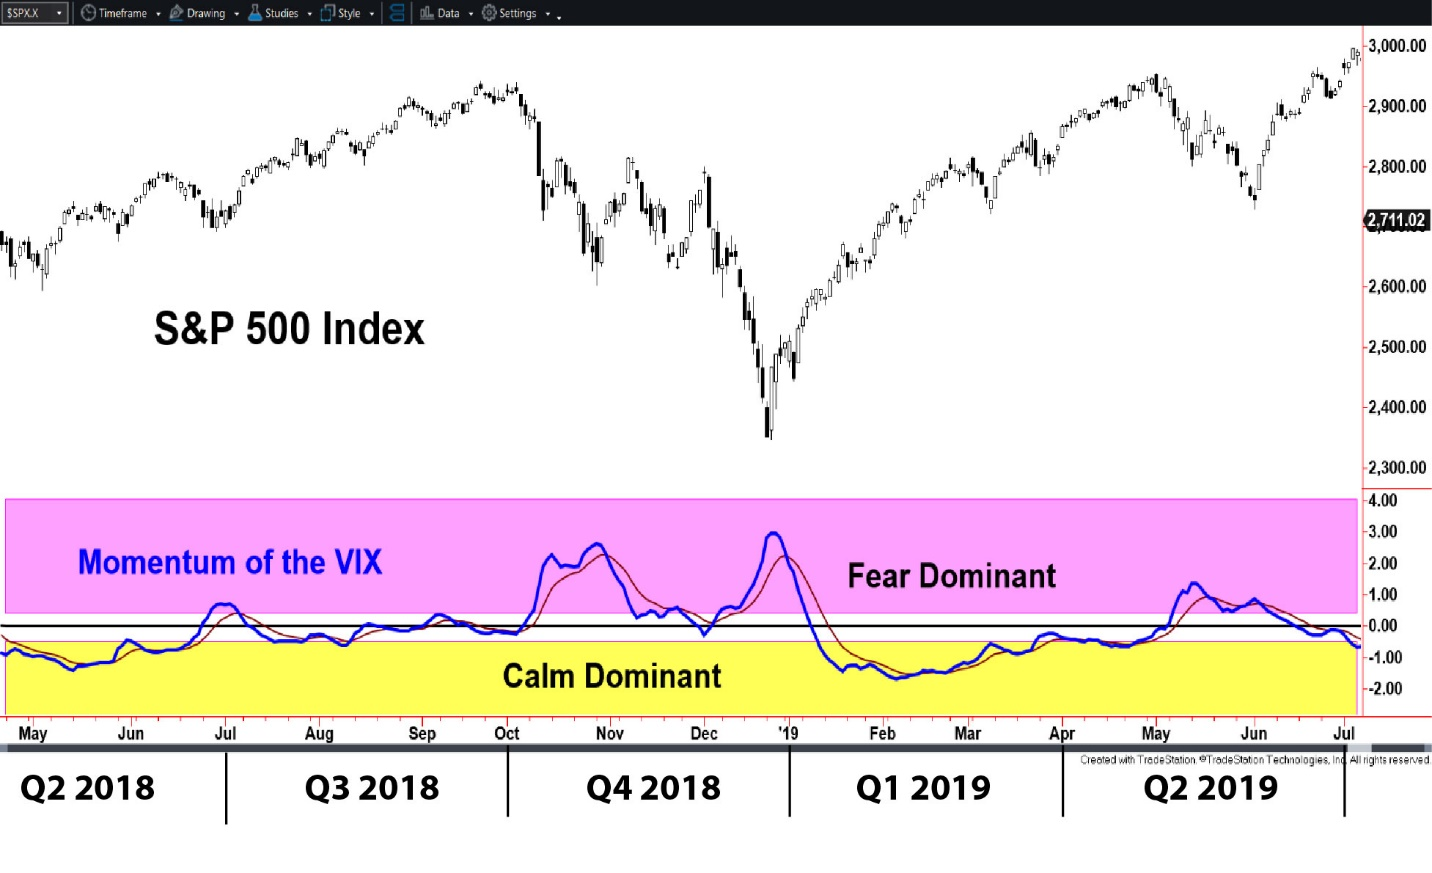
A relatively recent period of a sharp decline from new highs was Q3 2018, followed by the rebound in Q1 2019. Sure, this is not related to a previous virus, but the example shows a moving gauge of fear. The VIX Index is commonly called the “Fear Index” for good reason. In the chart below, the VIX itself is not displayed, but rather, a momentum indicator of the VIX. A momentum indicator measures the speed of price changes. Measuring the momentum (or speed of price change) of the VIX allows us to track that acceleration or deceleration of fear. Even with the VIX smoothed by the indicator, it still has some gyrations. If we follow the general direction and the overall zones, such as Fear Dominant or Calm Dominant, then we can get a better handle on the connection to the movement in the stock market.
 Created with TradeStation. © TradeStation Technologies, Inc. All rights reserved
From May to October 2018, the Momentum of VIX was dominated by calm, allowing for the S&P 500 to trend higher. Naturally, fear crept higher as the rally became older. In early October, the Momentum of VIX moved out of the middle neutral zone and into the Fear Dominant Zone. At that moment in October, I’m sure some questions were asked that are being asked today such as, “What about precedents?” And, “How long should this last?”
The bottom-line question for today is, “How long is the crisis going to last?” and that question may have two basic answers.
The first may be related to the headlines and the second related to the stock market sell-off. The two are not necessarily tied together. Headlines may still be scary to the public but if some underlying forces are changing investor perceptions, then the stock market has a higher probability of improving. In the chart above, the sharp drop in the Momentum of VIX at the very beginning of 2019 was enough to cause it to reach the Calm Dominant zone. If the charts and tables in October 2018 stated the market would be higher six months later, then, yes, they would have been right. However, this example shows the ongoing warning of the selling pressure for several months until the climate of fear changed.
Earlier this week I started to have a few body aches and a low-grade fever, both very minor. Regrettably, I went into the office before sunup to get some work done, thinking I’ll go home if my condition worsened. As people came into the office and became aware of my condition, the growing fear was palpable. I was urged to go to the doctor, but to call first. I called a well-known walk-in clinic but was told they were not prepared to test for Covid19 and was instructed to go to the emergency room. I did and was given a screening tests, including a chest x-ray by medical personnel in full protective body suits. I learned the hospital reports the findings to the local health department and then to the Center for Disease Control (CDC) for further instruction – to administer a rare Covid19 test or not. Fortunately, it was determined I have a more common flu strain. That said, I am writing this blog from quarantine – a self-quarantine but one advised by the doctors. In the days since the emergency room visit, news on a local and federal level has intensified to where grocery shelves are being emptied even for seemingly random items. I am seeing firsthand how the fear related to the headlines may get worse before getting better, but as a financial professional, I am monitoring the change in fear to get a better gauge on the impact to the financial markets.
