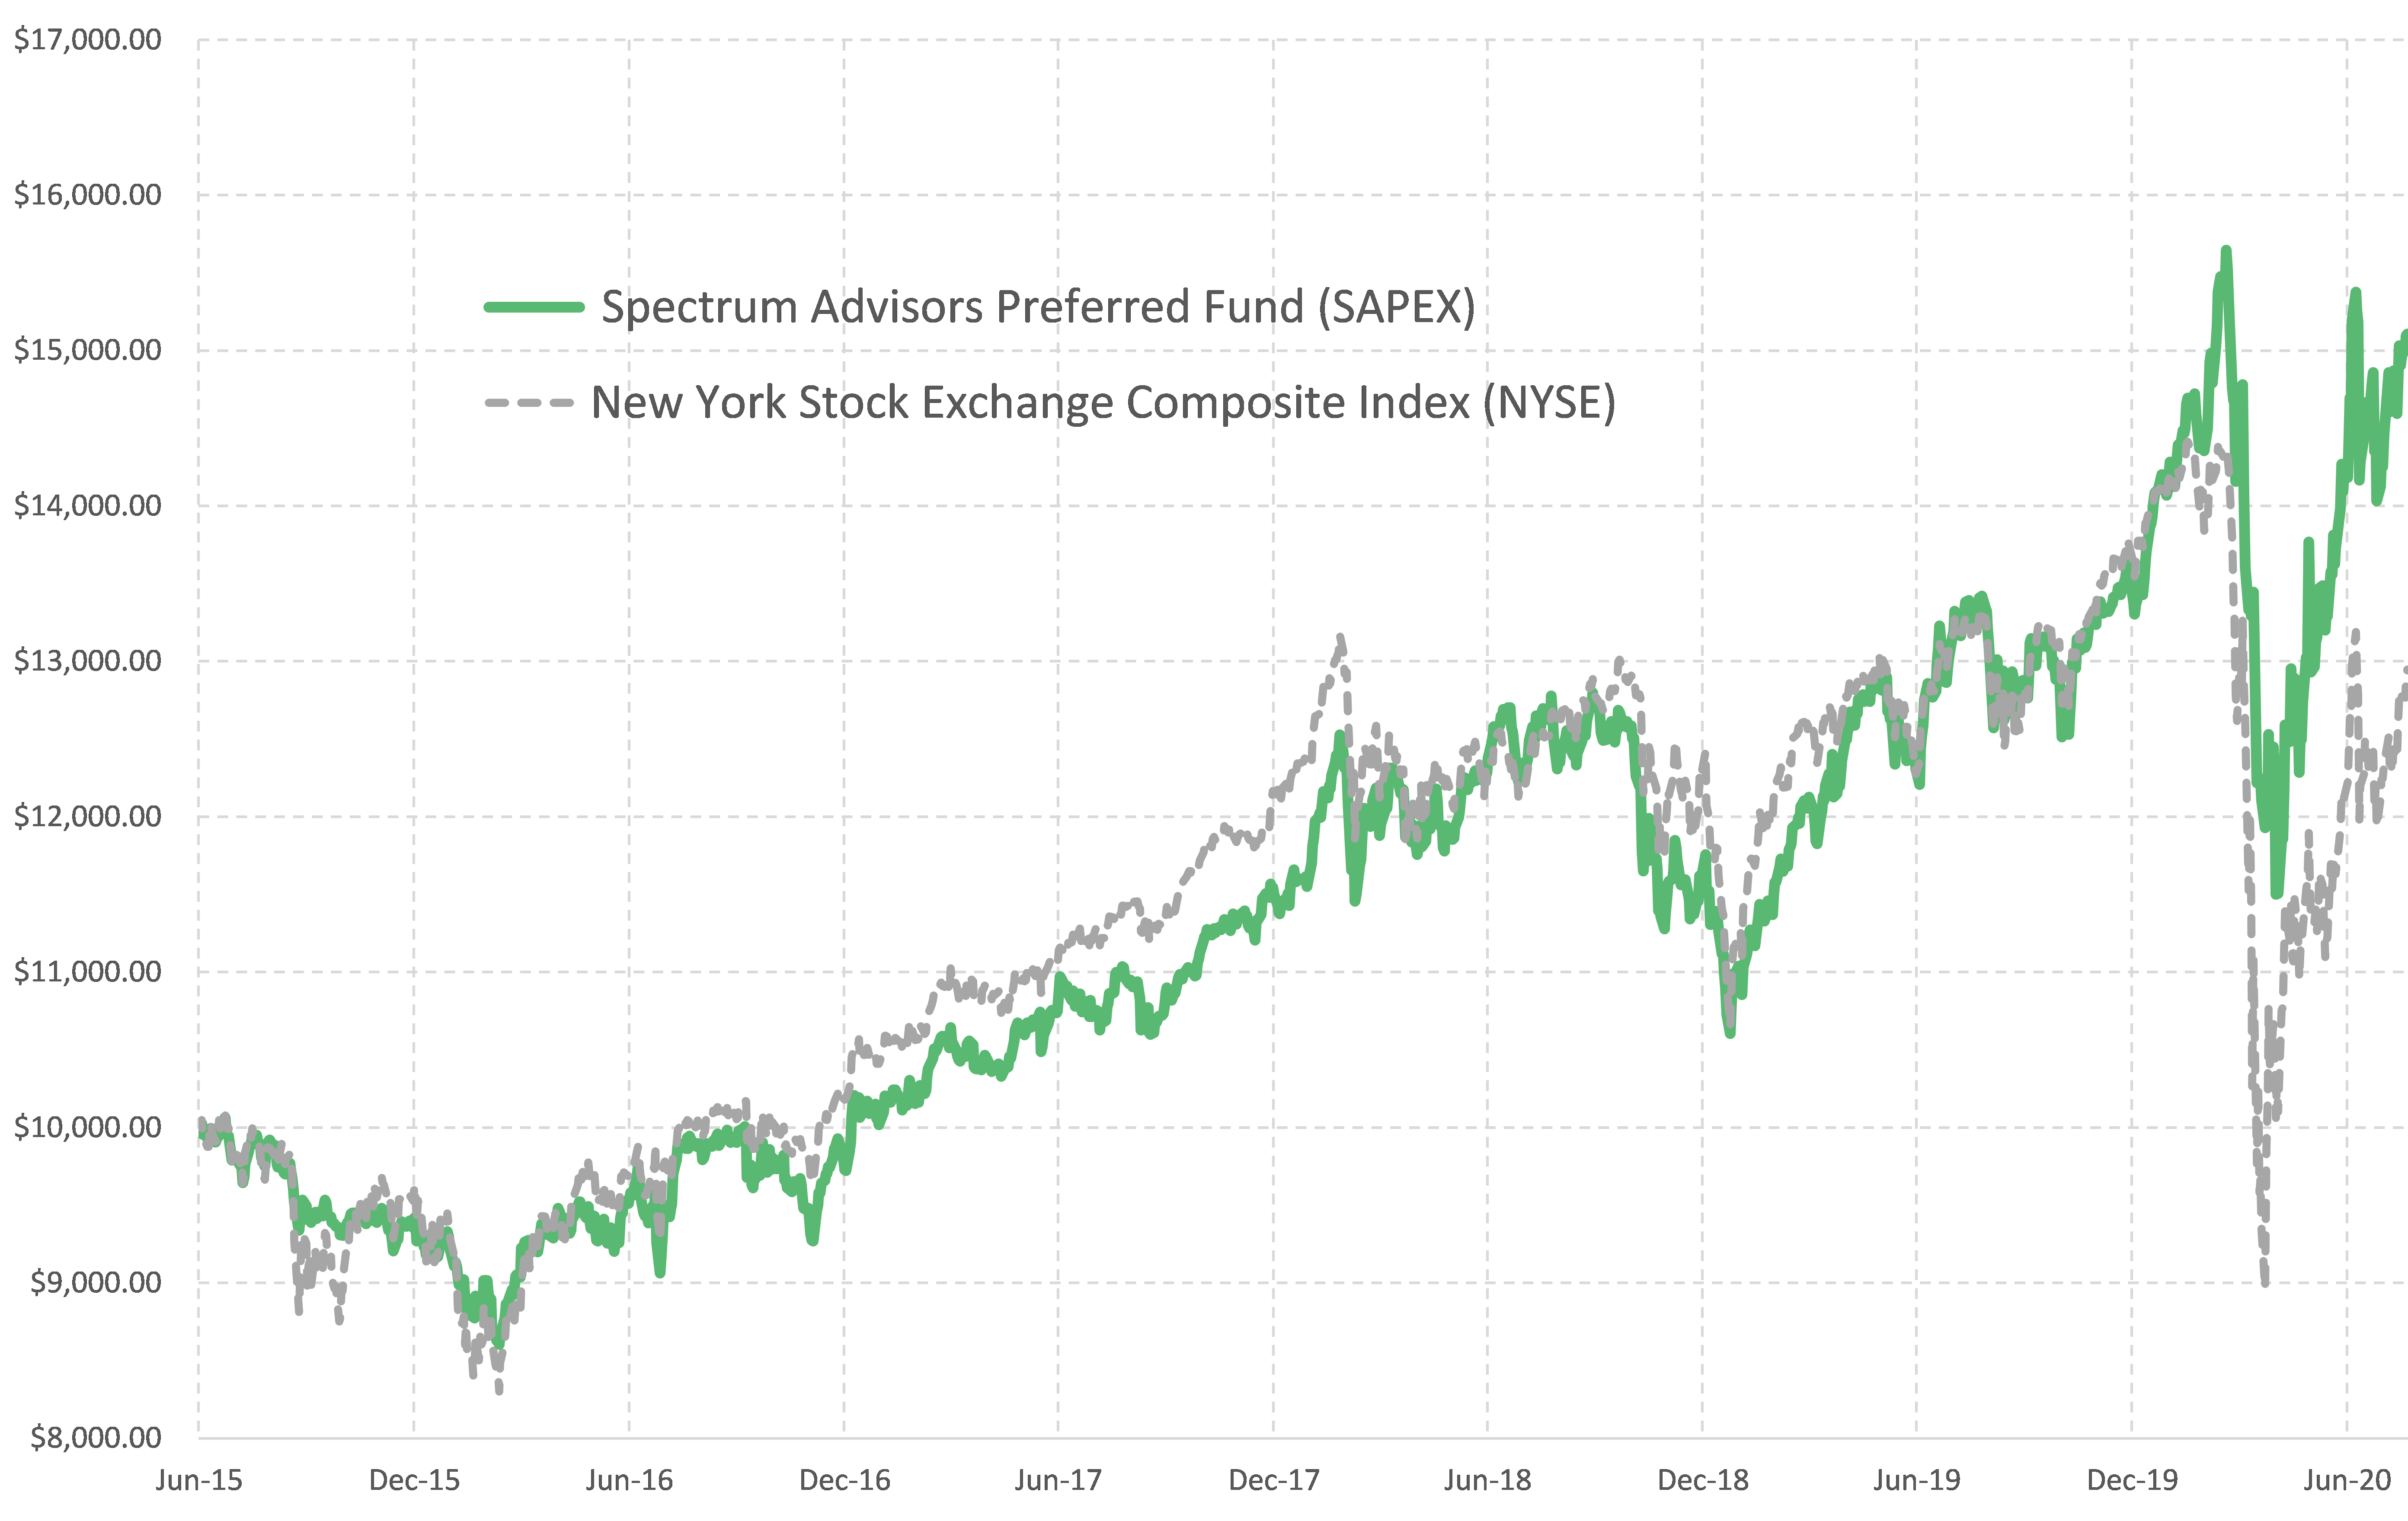
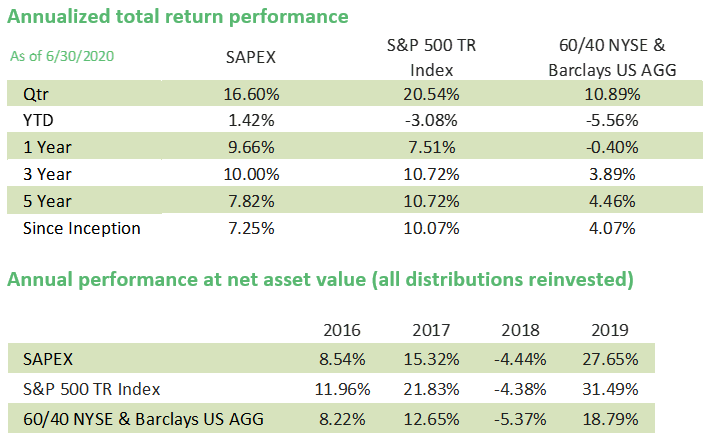
Spectrum Advisors Preferred Fund (SAPEX) celebrated its 5-year anniversary on 6/1/2020, and completed the second quarter of 2020 with its best quarter ever, up 16.60%. Year-to-date through the end of the second quarter, SAPEX was up 1.42%, putting it well ahead of the broad-based New York Stock Exchange Composite Index (NYSE) still down -13.36%. With these exciting milestones just passed, now it a great time to highlight this unique fund. What is the Spectrum Advisors Preferred Fund (SAPEX) all about? Officially, SAPEX’s objective listed in its prospectus is, “long term capital appreciation”. Another way to put that is the objective is to provide an actively managed equity mutual fund that seeks long-term capital appreciation and a strategy that pursues positive alpha (excess return over a benchmark) while managing return volatility (price variability). A succinct bottom-line is the Fund strives to simply make more and lose less. That seems to be at the heart of what most investors are looking for, especially when it relates to the stock market.
 Data: Bloomberg L.P.
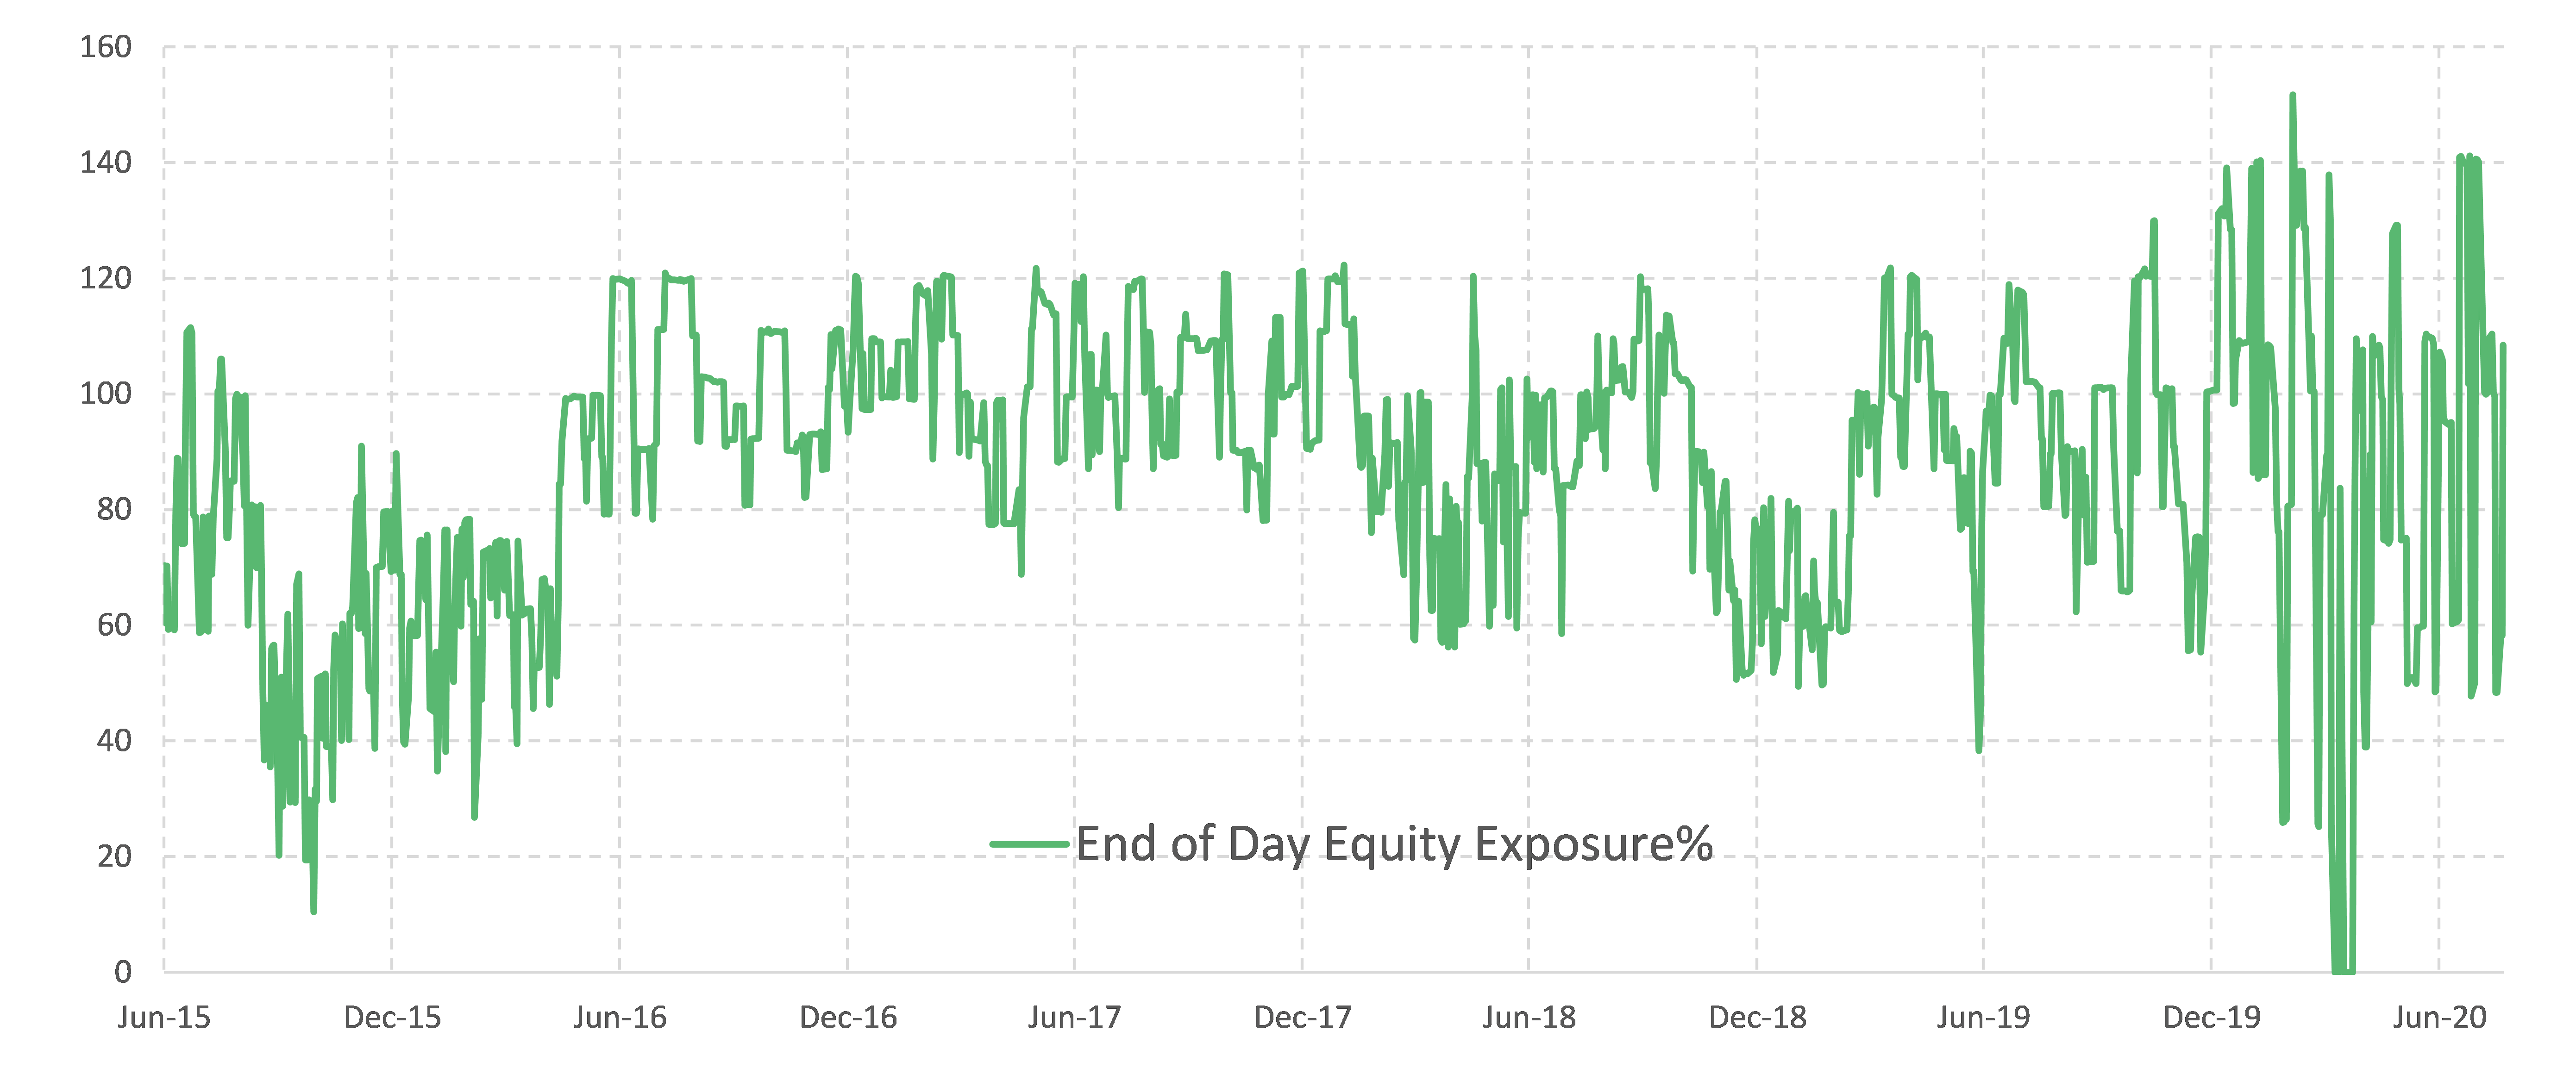 The Spectrum Advisors Preferred Fund (SAPEX) has always centered around tactical adjustments to risk while seeking timely buying opportunities. Even though the Fund primarily holds equity investments, there is a sleeve dedicated to bonds for defensive measures. The exposure chart above shows SAPEX’s nature of quick adjustments. From its 6/1/2015 inception to the end of 2018, SAPEX had a total return of 10.28% versus the 12.54% total return of the NYSE. This underscores the difficulty of beating a benchmark even with active management. During this period, however, SAPEX was much less volatile, having a Beta of 0.69 versus the index. Equity exposure changes have been more rapid and wider over the last year in an attempt to capture more return and offset risk. Since then, SAPEX’s Beta over the trailing twelve months (6/30/19-6/30/20) was only 0.76, a marginal increase, even as it began to outperform the NYSE stock index for that time period.
In addition to the 5-year anniversary milestone, the Spectrum Advisors Preferred Fund has been able to celebrate along the way. As mentioned, comparison to a benchmark while managing risk can prove challenging. Comparing to an index has its place but investors should compare possible fund choices to each other within defined categories. For the 2018 year, SAPEX was given a Refinitiv Lipper Award at the 2019 awards ceremony for being the “Best Fund Over 3 Years: Absolute Return Funds”. Go back to the noted statistic and the chart- SAPEX modestly underperformed the NYSE stock index during the period. Many investors were likely disappointed with their equity mutual funds during that time. This shows how difficult it is for mutual funds, as a whole, to hit the mark but SAPEX was beginning to show separation from its competitors as a prime choice in one’s portfolio. After 2019, the Spectrum Advisors Preferred Fund posted a repeat, once again winning an award for the 3-year Best Absolute Fund.
SAPEX is also tracked by Morningstar and as of the end of 6/30/2020 had a five star rating out of 215 funds for 3-years and a five star rating out of 171 funds for 5-years. We started recording Morningstar’s trailing 3-year performance ranking when the 3-year anniversary was reached.

The Fund received a 5-Star Overall Morningstar Rating as of 6/30/2020. Spectrum Advisors Preferred Fund (SAPEX) was rated against the following numbers of U.S Tactical Allocation funds over the following periods: 215 funds in the last 3 years, and 171 funds in the last 5 years. With respect to these Tactical Allocation funds, Spectrum Advisors Preferred Fund received a 5-Star rating overall and a 5-Star rating for 3 years and a 5-Star rating for 5 years. Past performance is no guarantee of future results.
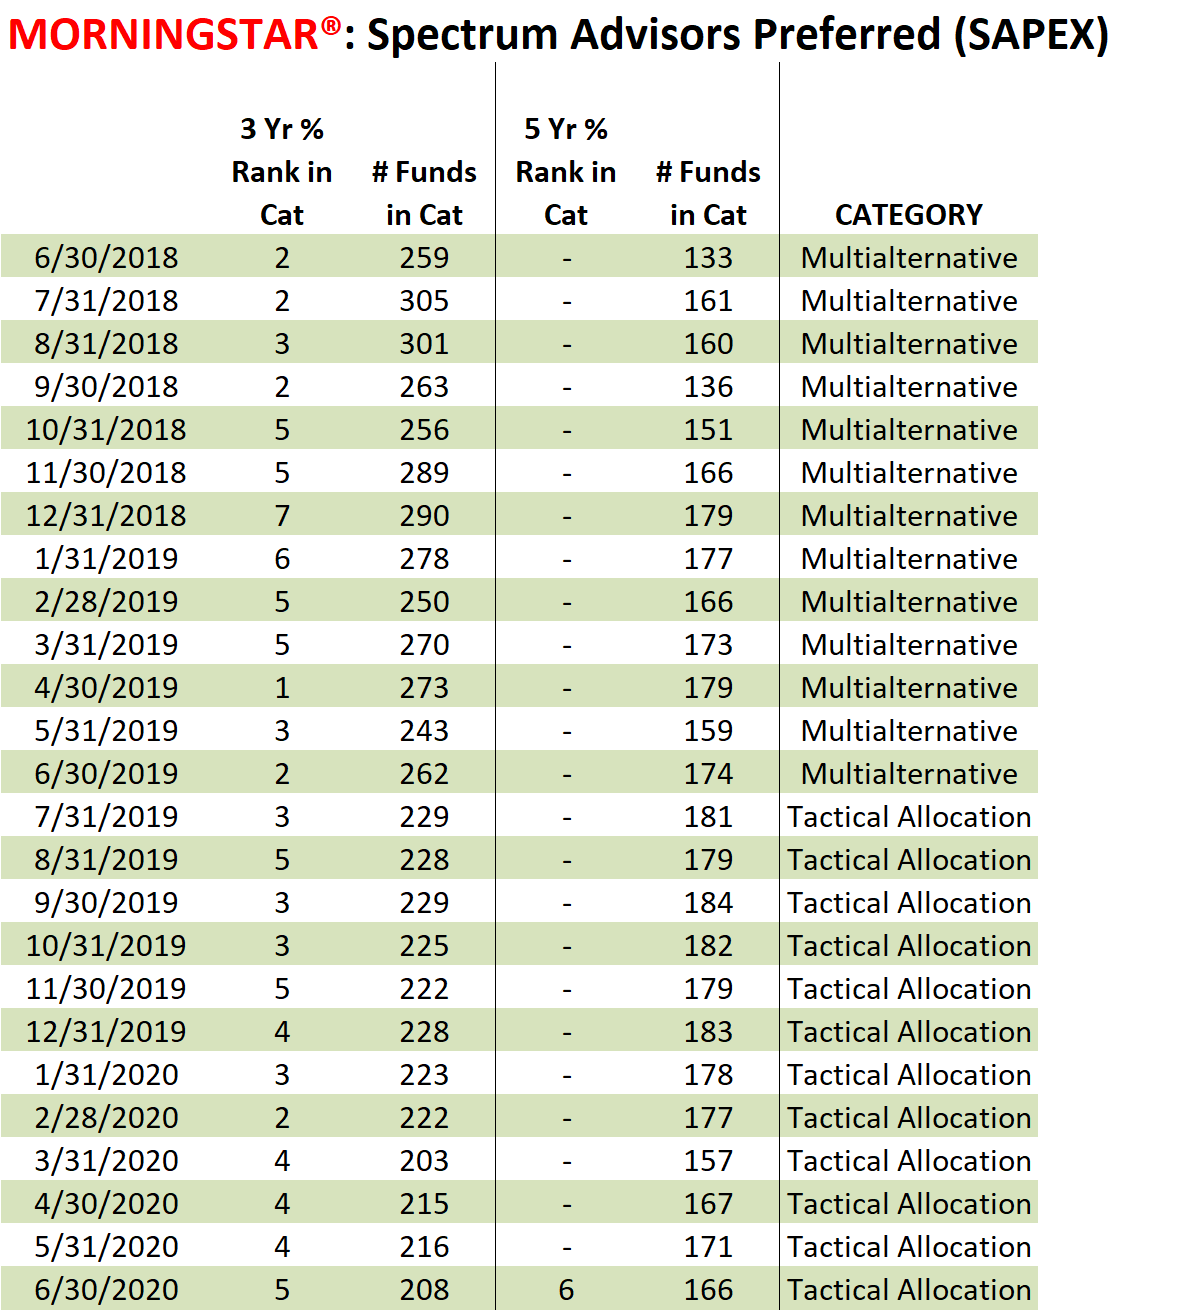
Near the upper left of the table, SAPEX’s performance was in the top 2 percentile out of 259 funds in Morningstar’s Multialternative category. Through 6/30/2019, SAPEX remained, at worse, in the top 7 percentile. From 7/31/2019 to present, Morningstar has SAPEX in the Tactical Allocation category. Since then, SAPEX has been at least in the top 5 percentile. With June of this year being its first month after its 5-year anniversary, SAPEX now has a trailing 5-year performance ranking — in the top 6 percentile.
More than five years ago, Ralph Doudera challenged the Investment Services team to design an equity focused fund that would allow him or its investors to sit back and “sip a Starbucks coffee” during the bull markets and then have it, to varying degrees, take defensive measures during bear markets. Becoming overly conservative was found to hinder performance. Allowing for more volatility and drawdowns during garden variety corrections but incrementally increasing the use of defensive tactics as bearish market action has allowed SAPEX to post a return since inception (6/1/2015-6/30/20) of 42.77% or 7.25% annualized versus a total return by the broad stock market, the New York Stock Exchange Composite Index (NYSE) of 22.37% or 4.05% annualized.
Disclosures
The performance data quoted represents past performance. Past performance does not guarantee future results. Investment return and principal value will fluctuate, so that shares, when redeemed, may by worth more or less than their original cost. Current performance may be lower or higher than the performance data quoted and assumes the reimbursement of any dividend and/or capital gains distributions. To obtain performance data current to most recent month-end, please call toll free 1-888-572-8868.
© 2020 Morningstar, Inc. All Rights Reserved. The information contained herein: (1) is proprietary to Morningstar; (2) may not be copied or distributed; and (3) is not warranted to be accurate, complete or timely. Neither Morningstar nor its content providers are responsible for any damages or losses arising from any use of this information. Past performance is no guarantee of future results. The Morningstar RatingTM for funds, or “star rating”, is calculated for managed products (including mutual funds, variable annuity and variable life subaccounts, exchange-traded funds, closed-end funds, and separate accounts) with at least a three-year history. Exchange-traded funds and open-ended mutual funds are considered a single population for comparative purposes. It is calculated based on a Morningstar Risk-Adjusted Return measure that accounts for variation in a managed product’s monthly excess performance, placing more emphasis on downward variations and rewarding consistent performance. The top 10% of products in each product category receive 5 stars, the next 22.5% receive 4 stars, the next 35% receive 3 stars, the next 22.5% receive 2 stars, and the bottom 10% receive 1 star. The Overall Morningstar Rating for a managed product is derived from a weighted average of the performance figures associated with its three-, five-, and 10-year (if applicable) Morningstar Rating metrics. The weights are: 100% three-year rating for 36-59 months of total returns, 60% five-year rating/40% three-year rating for 60-119 months of total returns, and 50% 10-year rating/30% five-year rating/20% three-year rating for 120 or more months of total returns. While the 10-year overall star rating formula seems to give the most weight to the 10-year period, the most recent three-year period actually has the greatest impact because it is included in all three rating periods. Morningstar Rating is for the Service share class only; other classes may have different performance characteristics.
The Lipper Fund Awards, granted annually, highlight funds and fund companies that have excelled in delivering consistently strong risk-adjusted performance relative to their peers. The Lipper Fund Awards are based on the Lipper Leader for Consistent Return rating, which is a risk-adjusted performance measure calculated over 36, 60 and 120 months. The fund with the highest Lipper Leader for Consistent Return (Effective Return) value in each eligible classification wins the Lipper Fund Award.
The currency for the calculation corresponds to the currency of the country for which the awards are calculated and relies on monthly data. Classification averages are calculated with all eligible share classes for each eligible classification. For more information, see lipperfundawards.com. Although Lipper makes reasonable efforts to ensure the accuracy and reliability of the data contained herein, the accuracy is not guaranteed by Lipper.
Lipper Leaders fund ratings do not constitute and are not intended to constitute investment advice or an offer to sell or the solicitation of an offer to buy any security of any entity in any jurisdiction. As a result, you should not make an investment decision on the basis of this information. Rather, you should use the Lipper ratings for informational purposes only. In addition, Lipper will not be liable for any loss or damage resulting from information obtained from Lipper or any of its affiliates.
Beta: a statistic that measures volatility of the fund, as compared to that of the overall market. The market’s beta is set at 1; a higher beta than 1 is considered to be more volatile than the market, while a beta lower than 1 is considered to be less volatile.
Consider these risks before investing: Bond risk, derivatives risk, equity risk, inverse ETF risk, junk bond risk, leverage risk, management risk, market risk, mutual fund and ETF risk, short position risk, small and medium capitalization risk, and turnover risk. There is no guarantee the fund will achieve its investment objective. You can lose money by investing in the fund. Please carefully review the prospectus for detailed information about these risks.
New York Stock Exchange Composite Index (NYSE) measures the performance of all stocks listed on the New York Stock Exchange. It includes more than 1,900 stocks, of which over 1,500 are U.S. companies. Its breadth therefore makes it a much better indicator of market performance than narrow indexes that have far fewer components. The weights of the index constituents are calculated on the basis of their free-float market capitalization. The index itself is calculated on the basis of price return and total return, which includes dividends.
S&P TR 500 Index is a capitalization weighted index of 500 stocks representing all major domestic industry groups. The S&P 500 TR assumes the reinvestment of dividends and capital gains. It is not possible to directly invest in any index.
*60/40 NYSE Composite/Barclays U.S. AGG. Bond Index: This benchmark gives 60% weight to the NYSE Composite Index and 40% weight to the Barclays U.S. Agg. Bond Index. The NYSE Composite Index (NYA) measures the performance of all stocks listed on the New York Stock Exchange. It includes more than 1,900 stocks, of which over 1,500 are U.S. companies. Its breadth therefore makes it a much better indicator of market performance than narrow indexes that have far fewer components. The weights of the index constituents are calculated on the basis of their free-float market capitalization. The index itself is calculated on the basis of price return and total return, which includes dividends. The Barclays U.S. Aggregate Bond Index measures the underlying index and performance of the total U.S. investment grade bond market. It is a market value-weighted index that tracks the daily price, coupon, pay-downs, and total return performance of fixed-rate, publicly placed, dollar-denominated, and non-convertible investment grade debt issues with at least $250 million per amount outstanding and with at least one year to final maturity.
Request a prospectus or a summary prospectus from your financial representative or by calling Gemini Fund Services at 855- 582-8006 or access www.thespectrumfunds.com. These prospectuses include investment objectives, risks, fees, expenses, and other information that you should read and consider carefully before investing. Gemini Fund Services serves as transfer agent to the Fund and is not affiliated with the advisor, subadvisor or distributor.