The stock market is often referred to as a single entity but is made up of many moving parts. Looking beneath the surface at single and multi-factor indexes can help investors better understand trends that may not be as visible when looking at the major indexes.
Factor investing has been around for many years but has only become more mainstream recently as investors have been given easier access to more specialized investments. This area has been evolving with the growing popularity of “multi-factor” investments. First, let’s begin with defining single factor investments and then progress onto more complex multi factor methods.
Single Factor
People tend to gravitate toward organization and categorizing information in order to better understand attributes and possible outcomes. As an example, consider this analogy between factor investing and cars. Cars with big V-8 engines tend to be fast and powerful while those with small four cylinders tend to be more fuel efficient and less performance oriented. Such a conclusion may not always be the case but is a tendency. Engine size is simply one “factor” when assessing an automobile. Investors do this with stocks too. The most widely recognized indexes are one factor, or “single factor”. A single factor may also be characterized by a sector such as a semiconductor index or a gold stock index.
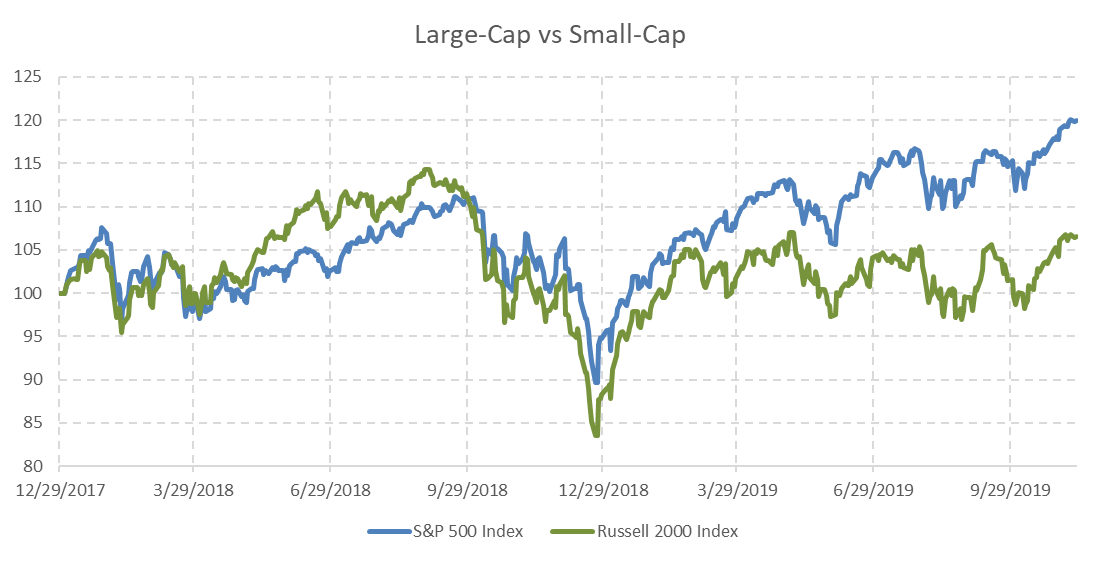
The S&P 500 Index may be diversified but it is simply the 500 largest companies. This makes size or market capitalization the single factor. Along the same lines, the Russell 2000 Index is a small-cap index. In the chart below, there was a clear distinction between the performance of large caps versus small-caps during mid-2018 as small-caps led the way higher. In 2019, large-cap stocks have been displaying overall leadership. This illustrates how factors can help explain what has been driving returns, giving a deeper perspective than over generalizing movements in the stock market. Investment choices have become more easily available to investors that attempt to give exposure to those factors.
Multi-Factor
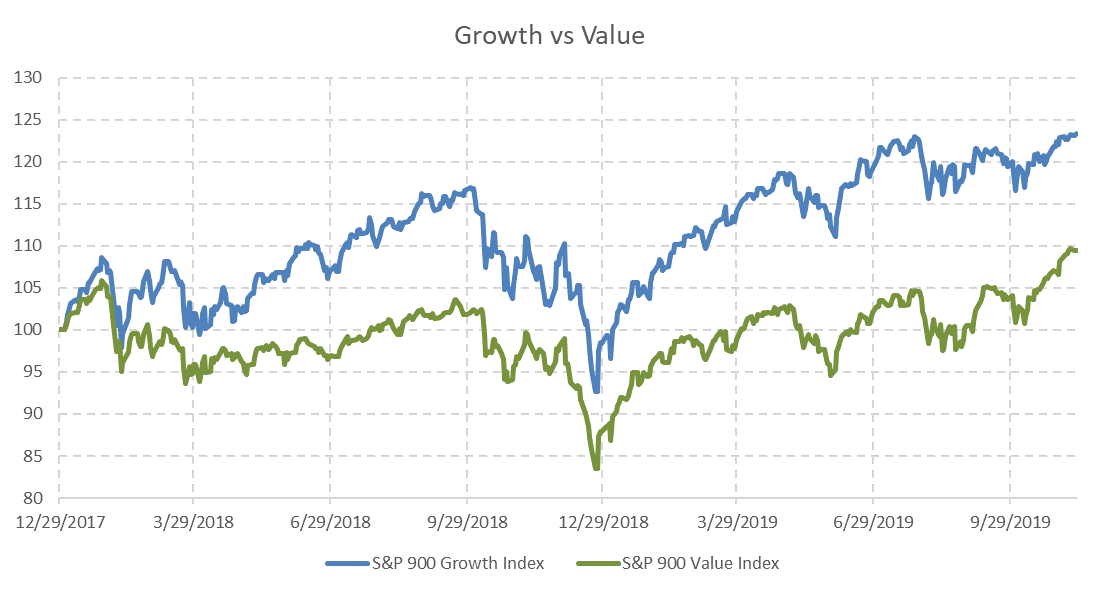
Multi-factor investments are the natural progression after single factor ones. Common multi-factors include value and growth. At first glance, these individually may sound like single factors but to determine value or growth, many factors are combined. For example, an index provider putting together a value or a growth index may use price-to-earnings ratios, price-to-book, or dividend yield among other criteria. These are most often well-defined, quantifiable filters to find stocks to be included in the index.
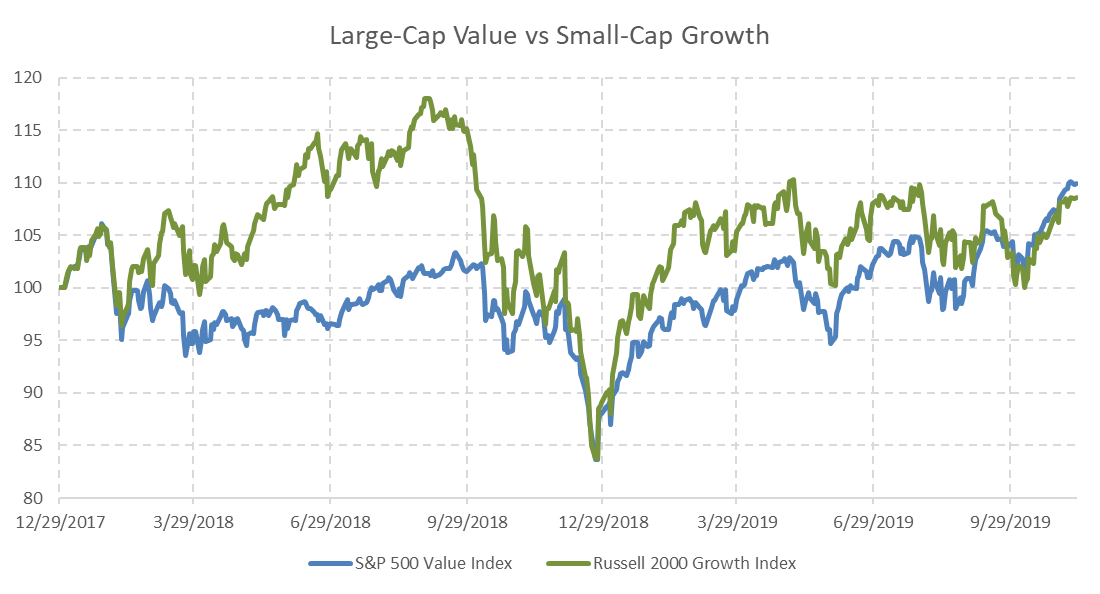
If some of the factors already covered are combined, the stock market can be broken down to an even more granular level often called “style investing”. Each size, small, mid, and large cap is then further separated into growth or value. In the chart below large-cap value is being compared to small-cap growth. During the first three quarters of 2018, value stocks were rather subdued while small-cap growth was rewarded.
Factor investing has adopted very specific characteristics beyond the historically common size or styles. Categorizing stocks down to attributes can yield an interesting perspective. Some examples are high and low volatility, value, momentum, and quality. These tend to be multi-factor as it can take a combination of numerous filters to find stocks with the targeted characteristic.
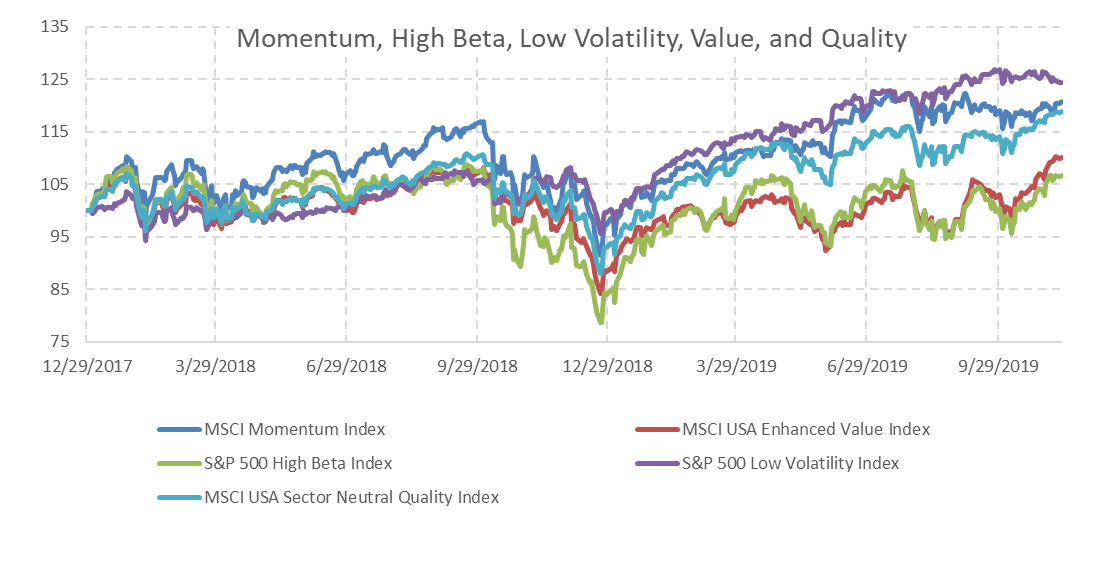 A momentum factor index or investment may use the performance return of multiple time frames and may be absolute returns, or the stocks return, relative to a benchmark. Some index companies define momentum as positive earnings momentum (growth factor). Quality factor investments may include formulas that filter for companies with low debt, stable earnings growth, and measures of profitability. The recipe for making a multi-factor index it generally transparent and can be found in documentation released by the indexing company.
Having factor-based investment choices allows investors to be positioned to possibly take advantage of various economic or technical conditions.
- Quality and lower volatility factors may take on defensive characteristics during times of stress in the markets.
- Momentum and higher beta factors may take advantage of bull market rallies when higher risk is being rewarded.
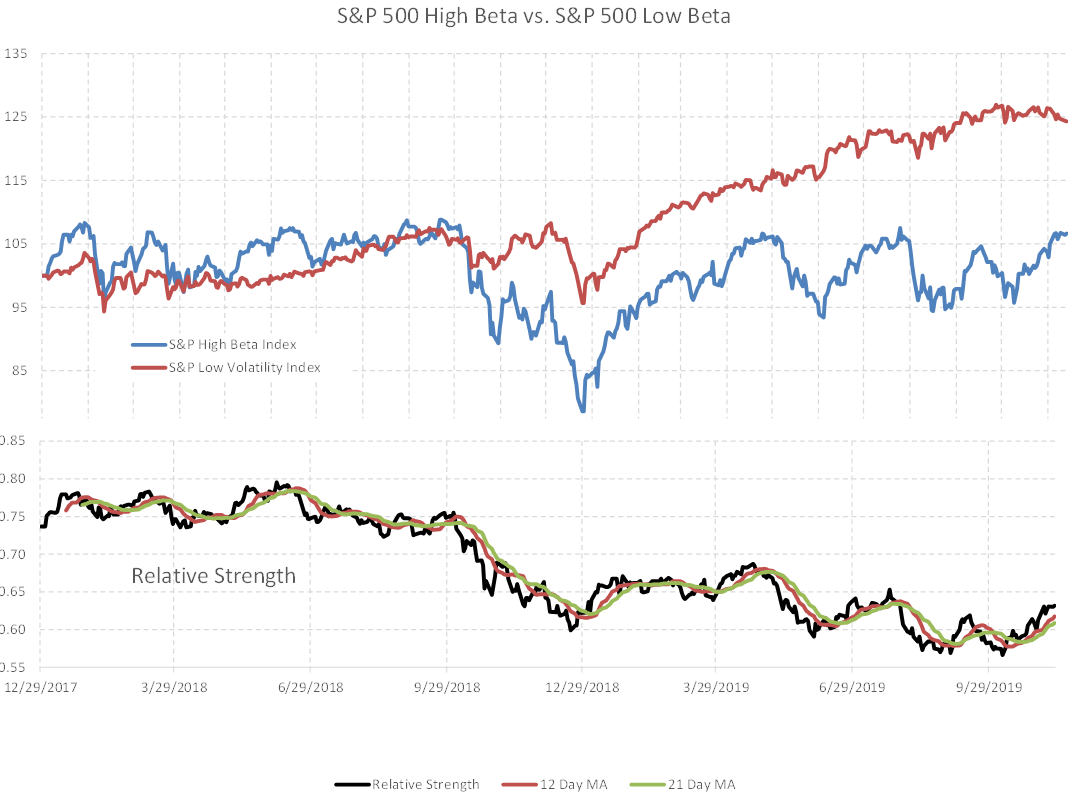
Active portfolio managers may use rotation methods, moving between various factor investments as conditions change. In the chart below, the black lined Relative Strength, displays the performance of the high beta factor to the low volatility factor. A rising black line conveys leadership by the high beta index and a falling line shows leadership period by the lower volatility index. Technical analysis methods can be applied to the Relative Strength line in order to better define the trend of leadership and its transitions.
 Uncovering the idiosyncrasies of the stock and bond market in order to invest strategically has always been an obsessive compassion of the portfolio management team at Spectrum Financial. The team uses several disciplines and factors when constructing portfolios and making investment decisions for its clients.