Sentiment is defined within the investment community as investor attitude toward a broad market or asset class. Following sentiment can be a useful endeavor as a component of risk assessment. Growing bullishness can help investments rise but overly optimistic attitudes often occur near market peaks. On the opposite side, bearish attitudes can pressure markets lower, but overly pessimistic or fearful actions can wash out those sellers to set the stage for a recovery.
Sentiment can be measured a number of ways, but most fall under the categories of investor perception surveys or detection of their actual actions. Surveys can be verbal or online and generally reflect what responders think of the market in an upcoming time frame. Responders may or may not have acted on their beliefs.
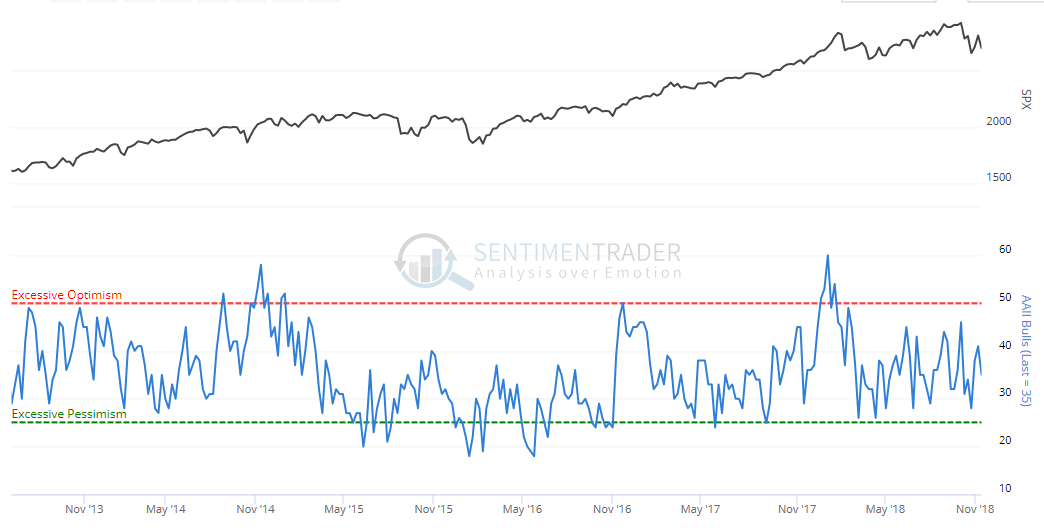
Above is an example of a survey by the American Association of Individual Investors (AAII). The scale to the right of the survey (lower pane), displays the percentage of the responders with a bullish outlook for the S&P 500 Index over the subsequent six months. Notice the survey number tends to track the movements of the stock market. Human nature is such that what is happening now tends to heavily influence perceptions of the future – if it’s bad now, then it will be bad or worse in the future.
Herd mentality can provide the fuel to a rally or sell-off as people’s actions are a natural by-product of their thoughts.
At extremes, the intensity tends to mark turning zones. Therefore, assessing sentiment can be useful as a contrary indicator but only after determining what qualifies as an extreme. In the chart above, zones of Excessive Optimism and Excessive Pessimism have been marked. Excessive optimism has been a worthwhile warning prior to major and minor peaks or at least stagnation. Excessive pessimism tends to be seen near lows. Not all market peaks and bottoms are accompanied by sentiment extremes using the AAII survey but when extremes show up, this information may play a role in portfolio adjustment.
As noted, surveys convey investor perceptions but as the saying goes, “actions speak louder than words”. There are numerous ways to detect sentiment derived from actions taken by investors. The options market often attracts speculators looking to leverage their ideas of bullish outlooks by way of buying call options or bearish outlooks with buying put options.
 Created with TradeStation. © TradeStation Technologies, Inc. All rights reserved.
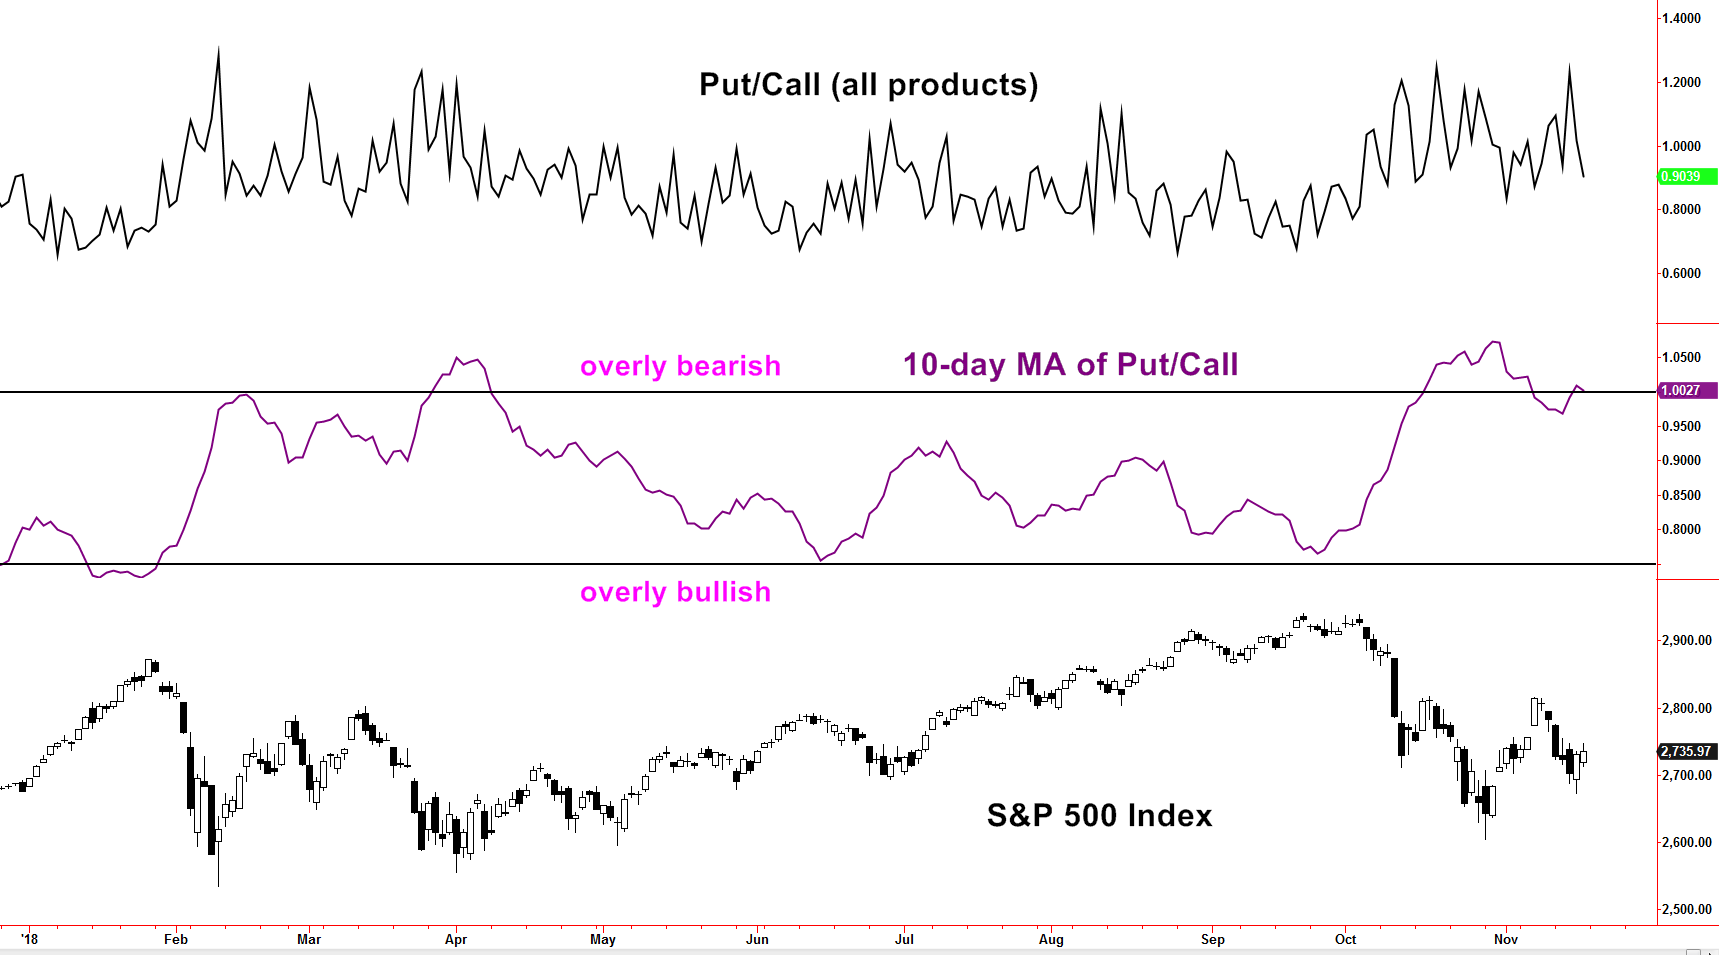
Put/Call ratios display the number of puts versus the number of calls traded. A ratio of 1.0 means an equal number of puts and calls are being purchased but that sort of balance is not the norm. The stock market and investor perception generally have a positive longer-term leaning which tends to have average Put/Call readings around 0.9 or nine puts purchased for every ten calls. In the chart above, the raw Put/Call is displayed but the zig-zagging raw readings can be too short-term to be useful for most investors. In the middle pane, a 10-day moving average has been applied to better illustrate the ebb and flow of sentiment.
Sentiment analysis can come from various sources and deal with multiple time frames. Surveys tend to be longer term while option related sentiment measures tend to be shorter-term. In mid to late October, weakness in the stock market had survey readings decline but without excessively pessimistic readings. Fearful or bearish speculators rushed to put options with more intensity than bullish buyers of call options. That set up overly bearish extremes prior to the early to mid-November rebound. Keeping tabs on sentiment can assist in keeping emotions in check. If opinions of market match overly optimistic or pessimistic sentiment readings, then re-evaluation may be in order. Investors would be wise to not use this information in a vacuum but as a part of a more comprehensive plan.