
General Market Commentary
In spite of election uncertainty, consumer confidence has improved substantially, and in the US, job optimism is hitting a nine-year high. This remains the bedrock of economic growth. While businesses are slow to make decisions pending the election outcome, consumers don’t seem to have a problem. Current market reaction to the outcome of the election seems to prefer a Democratic president. But, if we end up with a Democratic president as well as Democratic majority in the House and Senate, I feel that the market will definitely not react well.
Inflation may begin to rear its ugly head and the Federal Reserve may raise short-term interest rates to combat it.
“The last time we had a series of rate increases was in 2004-06 following the 2002-03 recession/bear market. The Fed raised the Fed Funds Target Rate from 1.0% to 5.25% in 17 steps.
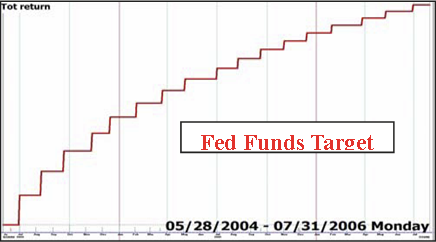 Michael Price OnTrack Report, 2016-20
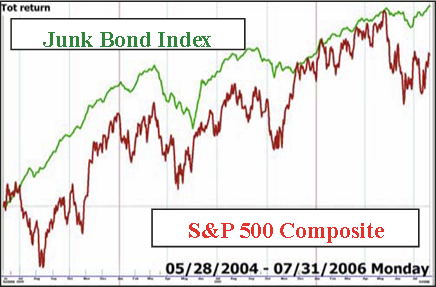
The stock market initially sold off when the Fed started raising rates, but soon reversed course and moved higher. During the 25-month period shown on these charts, the S&P 500 gained 13.92% — and junk bonds fared even better. Junk bonds did not sell off with stocks when rates started to rise, and the ML Junk Bond Index gained 18.84% during the 25-month period — with much less volatility than the S&P 500.” Michael Price OnTrack Report, 2016-20
 Michael Price OnTrack Report, 2016-20
Floating Rate Funds (Senior Loans) vs. High Yield Bonds
A low interest rate environment creates challenging opportunities to seek out alternative investment strategies that produce respectable returns and still limit risk. Most people do not recognize the risk involved in government bonds when interest rates rise, or in high yield bonds when a recession begins.
Senior loans may be a solution to this dilemma. These investments are secured corporate loans made to a company and rank in seniority ahead of other unsecured high yield bonds that the company may own. They offer a floating rate that can take advantage of rising interest rates, which we currently see on the horizon, by increasing the loan terms as interest rates increase.
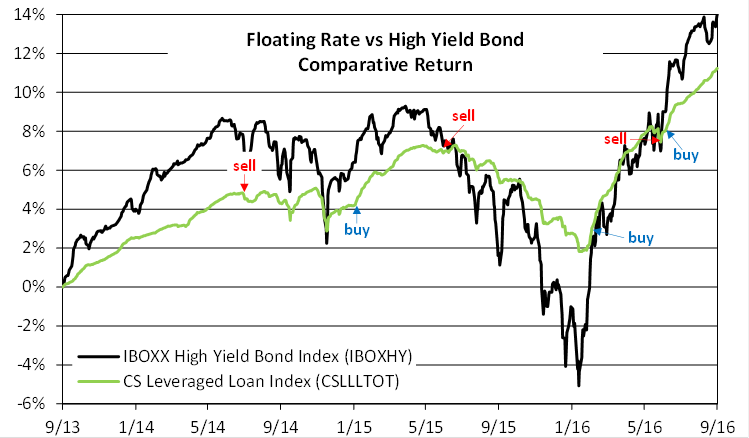
These investments also offer strong and stable current income in both high and low interest rate environments, superior credit position due to being in a senior position, and lower volatility of price, thanks to removal of most interest rate risk as well as credit risk. For example, the chart below illustrates the return and volatility of the floating rate Credit Suisse Leveraged Loan Index (CSLLLTOT) compared to the iBoxx High Yield Bond Index (IBOXHY) for the past three years. You should note that although performance for the period is similar, floating rate funds are much less volatile. They are also easier to trade.
In addition, since rates can adjust upward in periods of rising interest rates, they may have outperformed other fixed income securities as is shown in the chart below.
There remains, however, a time to leverage these bonds and increase exposure, as well as a time to sell them and go to a safe cash position. These sell signals can be seen on the chart. By monitoring these investment alternatives, we continue to be conservative investors when risk increases, yet we maintain liquidity to go to cash when favorable conditions change.
Low Volatility Strategies
Many people have asked: How has Spectrum produced high returns for strategies that are supposed to have low volatility?
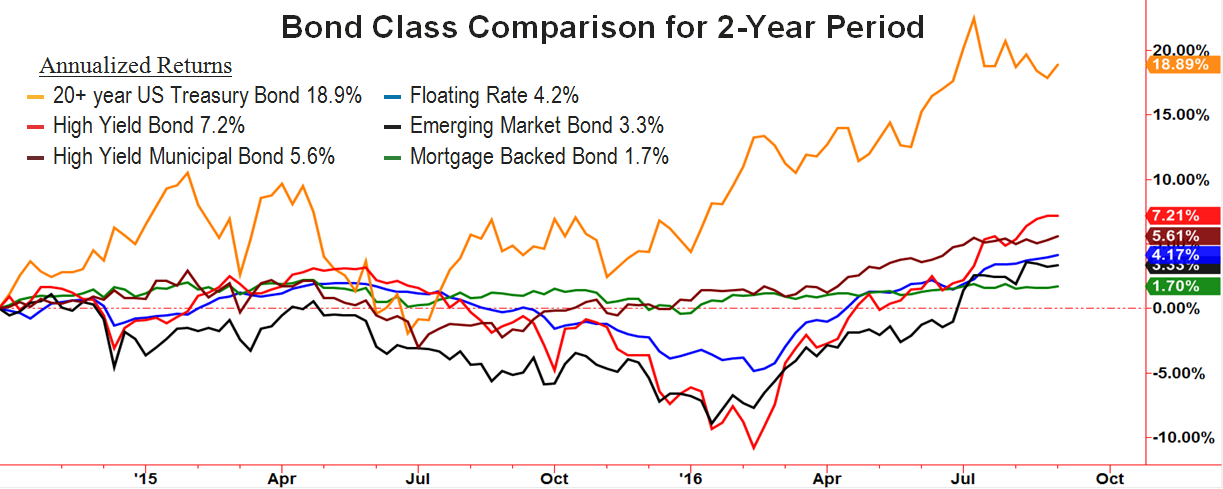
Low volatility does not necessarily mean low performance. Spectrum’s products are designed to take advantage of upward directional moves, and avoid drawdowns by using several integrated strategies. For those of us who took chemistry in school, it comes down to both qualitative and quantitative analysis. What to own and how much to own becomes the question. Since certain strategies primarily hold bonds, and because we have found that all categories of bonds do not move together, we have developed a selection process over the years to phase in and then phase out of bond sectors based on a ranking analysis of various sub-groups. The chart below illustrates performance of various sub-groups, which we monitor, and one can see different directional movements at various times. By rotating in and out of these bond sectors, we attempt to minimize drawdowns and select the groups with the highest relative performance. Finally, we evaluate market conditions to see how much of each bond class to own, and we may use leverage when appropriate.
 Created with TradeStation. © TradeStation Technologies, Inc. All rights reserved.
This blog contains excerpts taken from the October 2016 edition of The Full Spectrum newsletter. To continue reading please download the full copy here: The Full Spectrum: October 2016
Disclosure
Spectrum Financial, Inc. is a Registered Investment Advisor. The Full Spectrum is published quarterly for its investors and account executives. This publication is not intended to offer or solicit investment advice, nor should anyone act upon any suggestions made herein, without individual counseling from your account executive regarding risks involved. There is no guarantee that the recommendations of management will prove to be as profitable in the future, as they have in the past. The information presented in this issue has been obtained from sources believed to be reliable, but its accuracy is not guaranteed. Due to various factors, including changing market conditions, the content may no longer be reflective of current opinions or positions. A copy of Spectrum’s current written disclosure statement discussing advisory services and fees is available upon request. All rights reserved, please notify when quoting.
This writing is for informational purposes only and does not constitute an offer to sell, a solicitation to buy, or a recommendation regarding any securities transaction, or as an offer to provide advisory or other services by Spectrum Financial, Inc. in any jurisdiction in which such offer, solicitation, purchase or sale would be unlawful under the securities laws of such jurisdiction. The information contained in this writing should not be construed as financial or investment advice on any subject matter. Spectrum Financial, Inc. expressly disclaims all liability in respect to actions taken based on any or all of the information on this writing. For full disclosure please see disclosures page here.