Oil 101: An introduction to the oil market
At the time of writing this blog, a quick google search or inbox perusing will reveal oil market headlines that read something like this, “A few ominous signs in the world of oil..” Morning Brew; “A Serious Bearish Catalyst for Crude Markets” oilprice.com, “OPEC and BP Signal Pessimism in Oil Markets” nytimes. 2020 seems to take no prisoners, and the oil market did not escape its talons. The purpose of this article is to show the volatility and risk (specifically in oil) within the general commodities market if not actively managed by first outlining the market for oil. Oil is part of the commodities market. What is a commodity? Investopedia states, “a commodity market involves buying, selling or trading a raw product, such as oil, gold or coffee.” Think Tim Allen and Martin Short in the movie Jungle2Jungle. Remember when they didn’t sell all the coffee beans because Michael Cromwell (Tim Allen) was stuck in the Amazon meeting Mimi-Siku (his son) and the sell order didn’t go through to Richard (Martin Short)? They were stuck with coffee beans and went to a Russian buyer, it unraveled from there. A great movie, and also a great reminder of the commodities market- think raw product.
Who are the “oil market” suppliers?
 Crude oil (also called petroleum) is a finite, naturally occurring fossil fuel found below the earth’s surfaces in reservoirs. These reservoirs (or deposits) are found around the globe. The top 10 oil reserves around the world are found in:
- Venezuela- 303 billion barrels
- Saudi Arabia- 267 billion barrels (ironically enough, the US company Standard Oil was the first to drill for petroleum in Saudi Arabia back in 1933. Source: worldatlas.com)
- Canada- 167 billion barrels
- Iran- 155 billion barrels
- Iraq- 145 billion barrels
- Kuwait- 101 billion barrels
- United Arab Emirates- 97 billion barrels
- Russia- 80 billion barrels
- Libya- 48 billion barrels
- United States- 47 billion barrels (the largest oil producers in order: Texas, North Dakota, New Mexico)
The United States was the first country to create an industry out of oil production, and it was spear headed by John D. Rockefeller through the Standard Oil Company and Trust. However, OPEC+ is always synonymous with the oil market, its price, and its supply and demand cycles. According to opec.org, the Organization of the Petroleum Exporting Countries was created in 1960 with the intention of being a permanent intergovernmental organization between the five founding members: Iran, Iraq, Kuwait, Saudi Arabia and Venezuela. The objective of this organization is to, “co-ordinate and unify petroleum policies among Member Countries, in order to secure fair and stable prices for petroleum producers; an efficient, economic and regular supply of petroleum to consuming nations; and a fair return on capital to those investing in the industry.”(Source: opec.org)
Investing in the oil industry today
The first oil well to attract investors was an oil drill built by Edwin L. Drake for the Pennsylvania Rock Oil Company of New York in 1861. An investment industry was created to solicit funds for the purpose of drilling an oil well, and it began to evolve throughout the east coast of the US. Over 160 years later, there are multiple ways to invest in oil: Mutual funds, ETFs, oil futures, exploratory drilling programs, developmental drilling program, working interest program and rework programs, or even owning mineral rights. When it comes to investing, the question is often, “How can I make money betting on whether this is going to go up or go down? Especially for a commodity like oil, speculation is tied to the law of supply and demand.
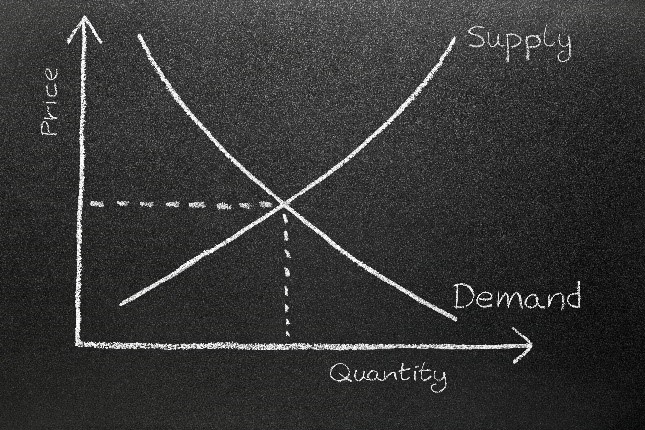
Oil in 2020
The equilibrium of price and quantity has been challenged in 2020 due to the global pandemic and issues amongst the OPEC+ members. This kind of environment creates uncertainty and volatility. March marked the onset of the COVID-19 pandemic in the United States. As the pandemic shut down the global economy and the US, the demand for oil plummeted leaving a massive oversupply. Saudi Arabia, one of the founding OPEC+ members, slashed their official pricing for its crude oil essentially creating an “oil war” with other OPEC+ members, specifically Russia. There was further breakdown between these two members when they failed to reach an agreement on deeper supply cuts. This marked one of the biggest cuts to oil pricing in over 20 years. Their objective was in pushing the prices lower, demand would tick up and they could flood the market with as many of their barrels as possible. As COVID-19 sank its talons into the global economy further, speculation in the oil market (represented by Oil future contracts) was fueled by panic. Investors began an accelerated sell-off as delivery dates for WTI (West Texas Intermediate) approached. April 20th, West Texas Intermediate crude dropped by almost 300% and traded negative, an unprecedented event. Oil is traded on its future price and the May futures contracts were due to expire on that Tuesday. The traders were keen to offload those holdings to avoid having to take delivery of the oil and incur storage costs.
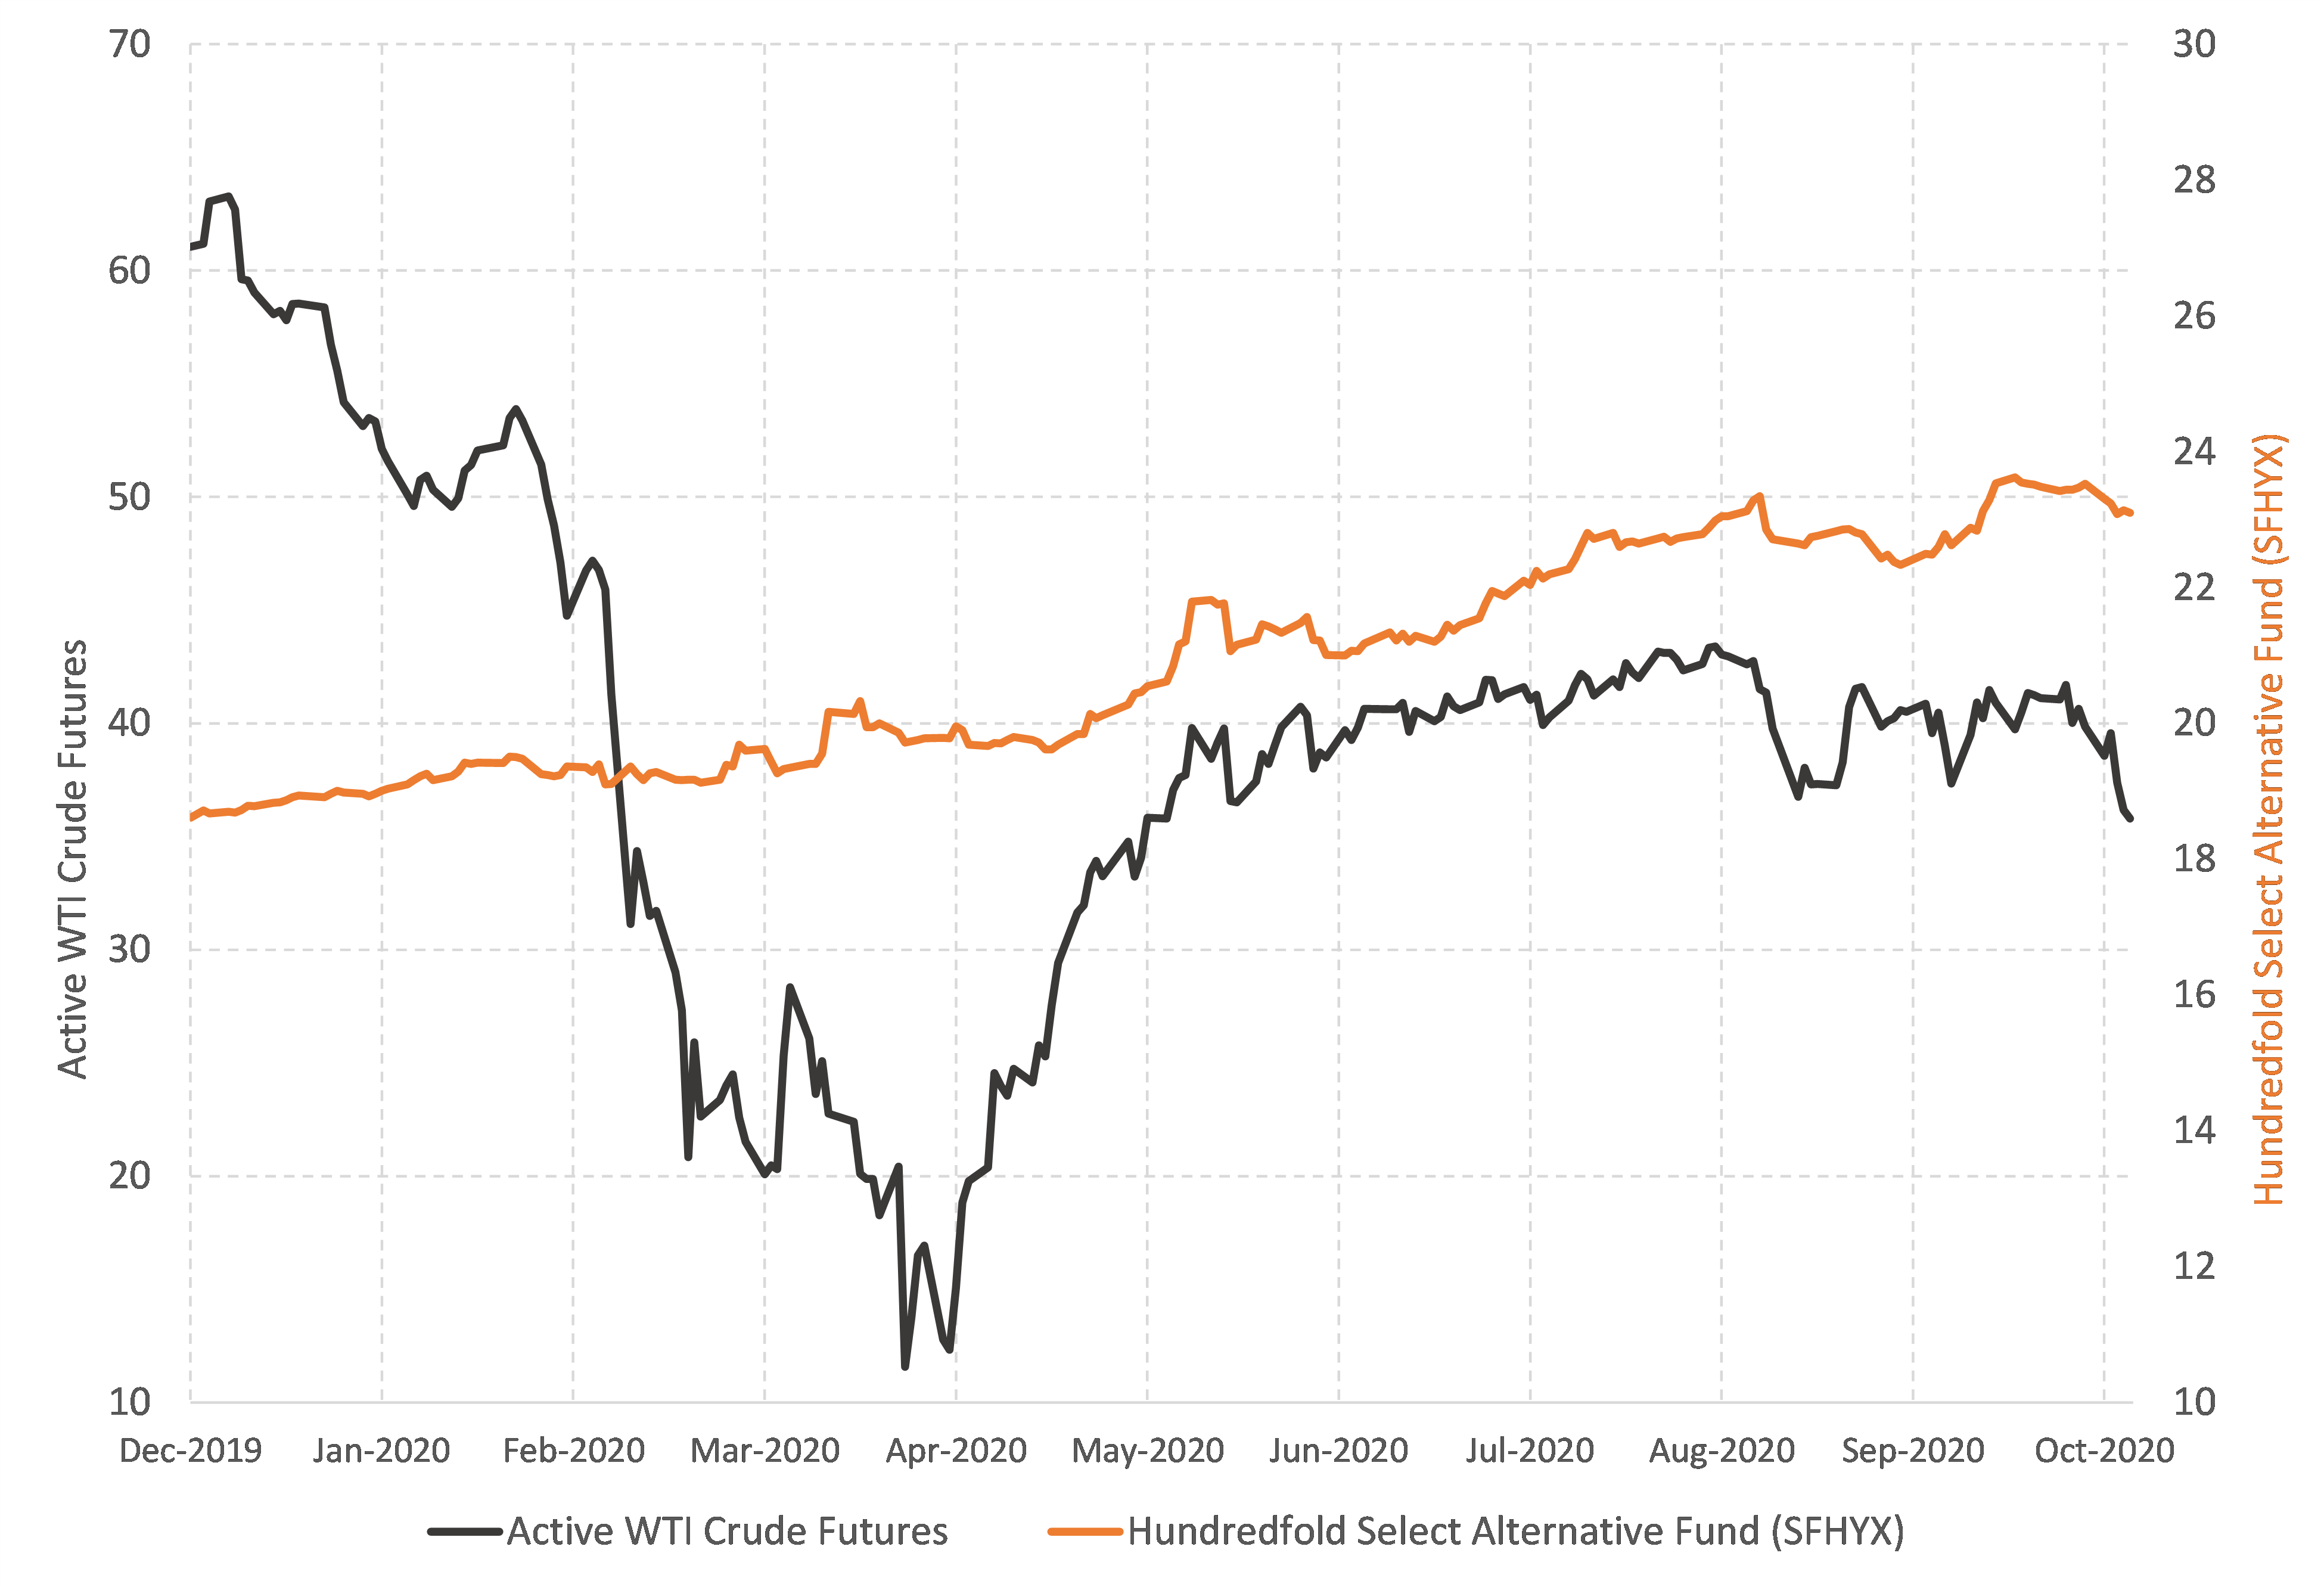
Investing in a commodity like oil can be an extremely risky and volatile investment. However, when it is given a small position size within a larger diversified portfolio it can contribute to positive alpha (returns) while limiting drawdowns within the greater portfolio. This is something that has been implemented with the Hundredfold Select Alternative Fund found in our AssetMaxx℠ program. The chart below shows the year-to-date performance through 10/31/2020 of the Hundredfold Select Alternative Fund (SFHYX) and the WTI Crude Oil futures. This is not indexed performance, and the chart splits the Active WTI crude oil futures on one axis (left) and the Hundredfold Select Alternative Fund (SFHYX) on the right axis. This chart is not meant to compare performance necessarily, but show the difference in volatility between the two.
 The following is an excerpt from our most recent quarterly newsletter,
Hundredfold Select Alternative Fund (SFHYX)—The All-Season Investment
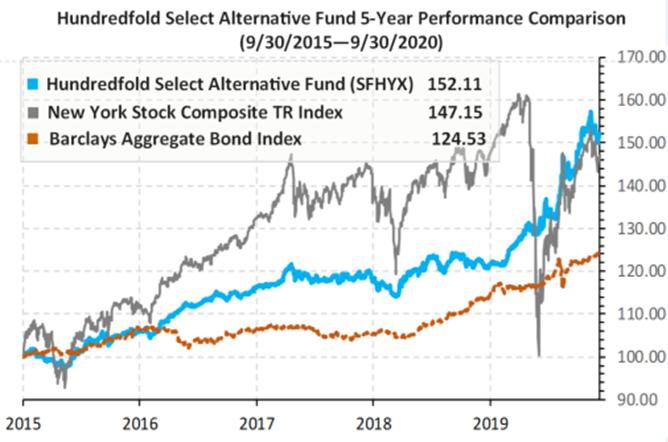
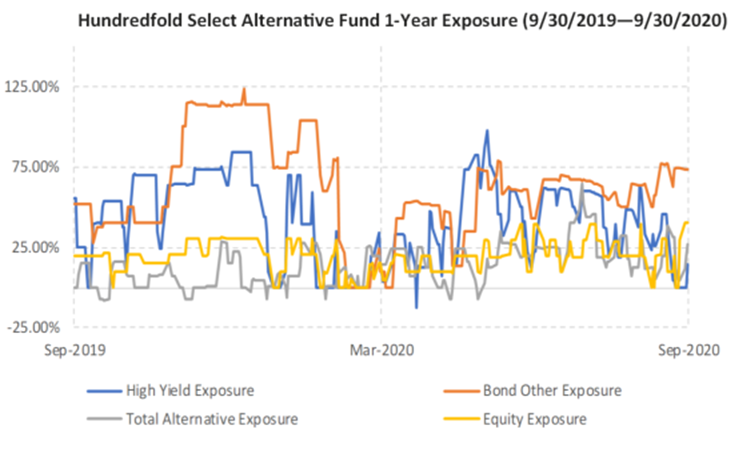
Navigating through one of the most challenging investment seasons in 2020 has once again proven to our investors that our active asset allocation strives to give them the peace of mind they require. Price declines of nearly 40% or more can make life-altering financial plans for investors. This has occurred three times since 2000. Changing market conditions happen so quickly now, that investors may not be able to handle the risks involved in a conventional portfolio. The Select Alternative Fund was created to utilize alternative investments where returns are not directly tied to the stock market, yet still provide comparable returns. Active management and diversification are the keys to its success. Formed with philosophy of King Solomon: “A cord of three strands is not quickly broken.” (Ecc. 4:13) the portfolio is divided into three parts, and diversified further within those categories. Currently, stocks are employed from 0% to 40%, using four 10% trading strategies; Bonds, from 0 to 120% using about ten different bond categories and rotational strategies; And commodities, from -50% to +50% using 10 different types of diverse commodities which may be either long or short positions. These strategies work together to complement each other with the objective of reducing risk and volatility, so the performance should not directly correlate to the stock market. For the first 9 months of 2020, SFHYX had a return +21.39% with a maximum drawdown of -4.3%. In contrast, the New York Stock Composite Index had a negative return of -6.94% for the first 9 months of 2020 with a maximum drawdown of -37.5%. The chart on the top right illustrates the past 5-year performance of SFHYX compared to the New York Stock Composite Index as well as the Aggregate Bond Index. The second chart below illustrates how actively the Fund is managed, showing asset class investments at various times over the last year, taking advantage of market opportunities when they present themselves, while reducing risk at other times.
 Please see standard performance information below:
Annualized total return performance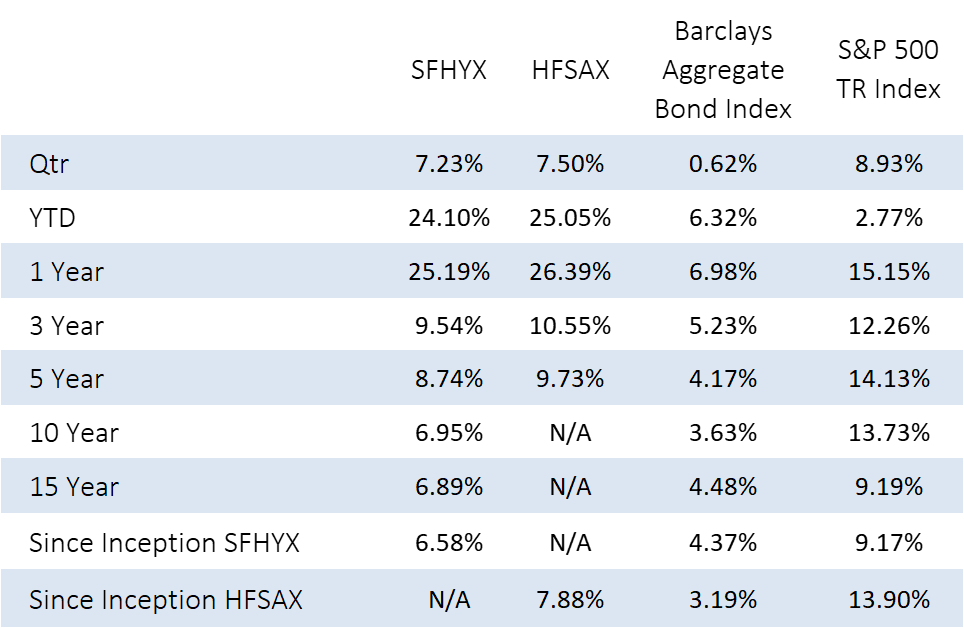
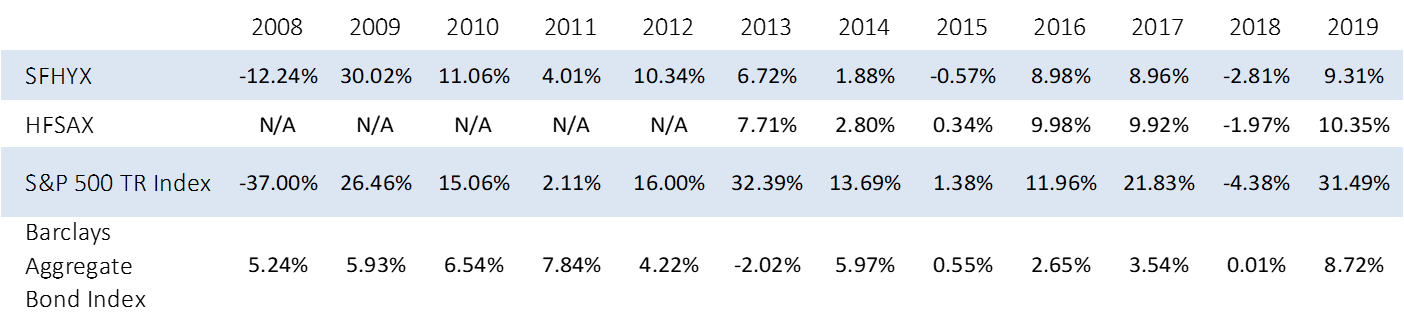
Annual performance at net asset value (all distributions reinvested)
Disclosures
The performance data quoted represents past performance. Past performance does not guarantee future results. Investment return and principal value will fluctuate, so that shares, when redeemed, may be worth more or less than their original cost. Current performance may be lower or higher than the performance data quoted and assumes the reinvestment of any dividend or capital gains distributions. To obtain performance data current to the most recent month-end or a prospectus, please call toll free 888-572-8868 or visit HundredfoldSelect.com for further details.
An investor should consider the investment objectives, risks, charges and expenses of the Hundredfold Funds carefully before investing. The prospectus contains this and other information about the Fund. The prospectus should be read carefully before investing. Distributor: Ceros Financial Services, Inc.
Advisors Preferred, LLC serves as Advisor to the Hundredfold Select Alternative Fund. The Hundredfold Select Alternative Fund is distributed by Ceros Financial Services, Inc. a commonly held affiliate of Advisors Preferred. Hundredfold Advisor, LLC is the subadvisor to the Hundredfold Select Alternative Fund. Hundredfold Advisors is not affiliated with Advisors Preferred.
- Inception date: SFHYX Sept. 1, 2004, HFSAX Oct 24, 2012
Consider these risks before investing: Aggressive investing techniques, asset-backed securities risk, credit risk, counterparty risk, depositary receipt risk, derivatives risk, emerging markets risk, equity securities risk, foreign securities risk, high portfolio turnover risk, high-yield securities risk, holding cash risk, interest rate risk, leverage risk, master limited partnership risk, non-diversification risk, other investment companies risk and ETFs risk, prepayment risk and mortgage-backed securities risk, shorting securities risk, small and mid-capitalization risk, subadvisor investment strategy risk, tax risk, and floating rate notes risk. There is no guarantee the fund will achieve its investment objective. You can lose money by investing in the Fund. Please carefully review the prospectus for detailed information about these risks.
BENCHMARK DATA:
- S&P 500 Index is a capitalization weighted index of 500 stocks representing all major domestic industry groups. It is not possible to directly invest in any index. The S&P 500 TR assumes the reinvestment of dividends and capital gains.
- Barclays U.S. AGG. Bond Index: measures the underlying performance of the total U.S. investment grade bond market. It is a market value-weighted index that tracks the daily price, coupon, pay-downs, and total return performance of fixed-rate, publicly placed, dollar-denominated, and non-convertible investment grade debt issues with at least $250 million par amount outstanding and with at least one year to final maturity.
- West Texas Intermediate Crude Oil Futures: The ICE West Texas Intermediate (WTI) Light Sweet Crude Oil Futures Contract offers participants the opportunity to trade one of the world’s most liquid oil commodities in an electronic marketplace. The contract not only brings the benefits of electronic trading a US light sweetcrude maker, but also brings together the world’s three most significant oil benchmarks on a single exchange: Brent, Middle East Sour Crude and WTI. This offers a reduction in collateral requirements through the offsetting of margins.