Not all equity markets around the world move together but there is an influence, or correlation, generally speaking.
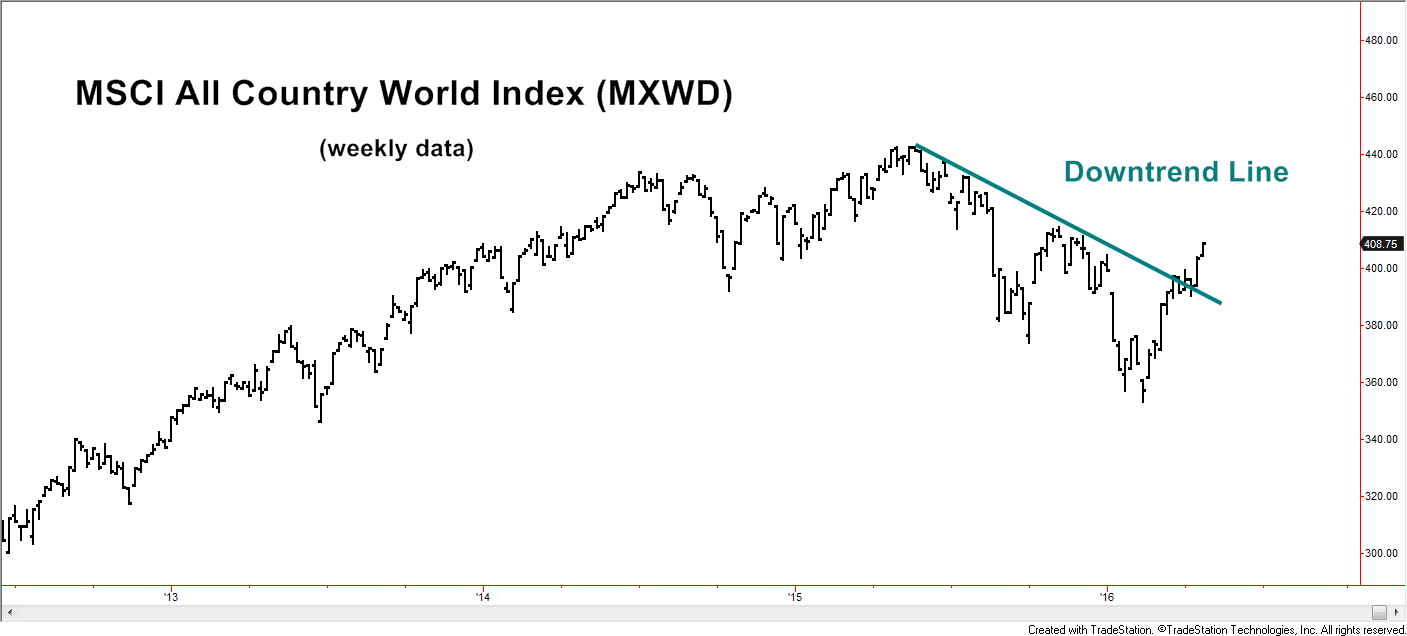
World equity markets began the year already in a correction, with additional sharp declines in January, see chart below.  However, since mid-February the MCSI All Country World Index (MXWD) has been in rebound mode within its downtrend, and recently broke above its downtrend-line . Traditional chartists would likely view such a break as a positive development.
Perhaps this “new” development is not so new if looking at the right clues .
CLUE #1 Momentum of Comparative Strength
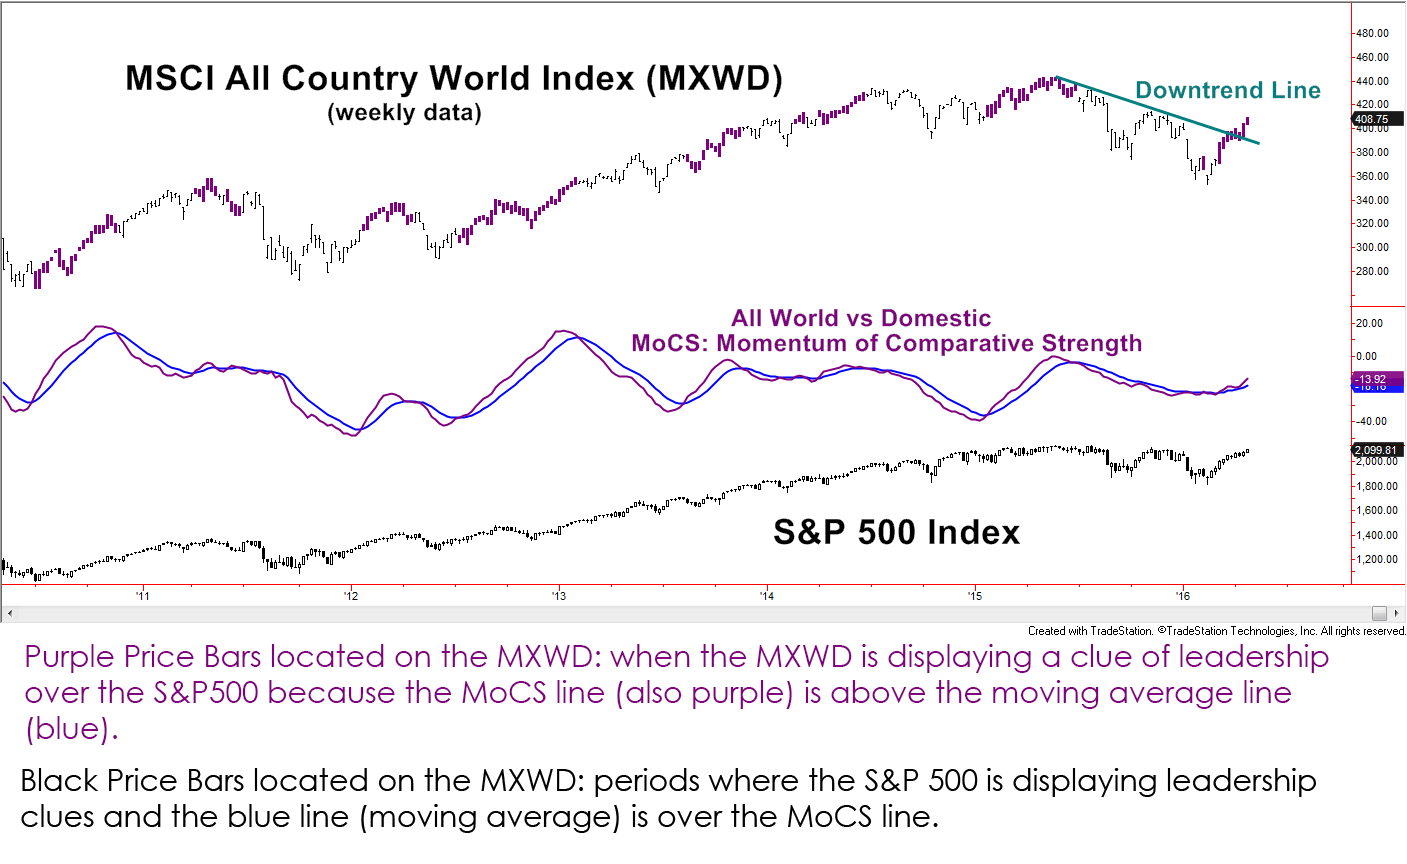
A common technique is to compare one investment to another. There are many different ways to do this; we are going to talk about one. The chart below displays the MSCI All Country World Index and the S&P 500 Index. The indicator in the middle goes beyond the traditional relative or comparative strength line by showing the momentum of the comparison between whatever is selected for comparison. This allows us to see if one is gaining momentum or losing momentum versus the other.
In this case a rising indicator, signaled by the purple line simply going up, would imply an improving pace of the MXWD versus the S&P 500.
It is important to state a rising line does not always mean the All Country World Index is going up faster than the S&P 500. It can mean it is simply going down at a lesser rate and thus, have a rising relative or comparative strength metric.
A moving average (blue line) has been added to the raw Momentum of Comparative Strength (MoCS) line in order to help define rising and falling periods. This is an example of adding more than one type of analysis tool.
- When the MoCS line (purple) is above its moving average (blue), the World Index is displaying a clue of leadership. Looking at the MXWD, those price bars are highlighted in purple.
- The black price bars on the MXWD are periods of lagging relative performance to the S&P 500.
Conclusion #1: The break above the downtrend line is not the FIRST clue!
Even though the break above the downtrend line just occurred, the current phase of comparative leadership versus the domestic market (S&P 500 Index) has been since very early March. What some have perceived as a recent development is not so recent.
CLUE #2 Know the markets’ tendencies & what ties them together
Now let’s look at foreign markets from a different angle. The 2-year chart below shows the downtrends of the developed markets, emerging markets and oil prices.
As mentioned earlier, equity markets around the world have a tendency to move in the same general direction but with differing intensities.
This can be seen in the chart below with emerging markets and developed markets.
Emerging markets tend to be more sensitive to changes in investor psychology. A reason behind the tangible (fundamental) and psychological (technical) influence is the connection of oil prices to emerging markets. Many of these countries are heavily reliant on export revenues from oil and related products.
Conclusion #2: Emerging markets had a more aggressive rebound than developed markets since early February due to oil’s corresponding rebound.
Improvement in oil prices usually have outsized positive effects on emerging markets which in turn, can cause emerging markets, or foreign stocks as a whole, to take leadership roles relative to domestic equity markets.
CLUE #3 Breadth
Clues can also be found within breadth measures. Breadth diversely assesses the movements of components making up an index. Examples of components are the 500 companies that make up the S&P 500 Index. Breadth information is usually derived from the following:
- Advancing issues & Declining issues (example: 400/500 companies on the S&P 500 are increasing while 100 are declining)
- New 52-week highs & New 52-week lows
- Trade volume of advancing issues & Trade volume of declining issues
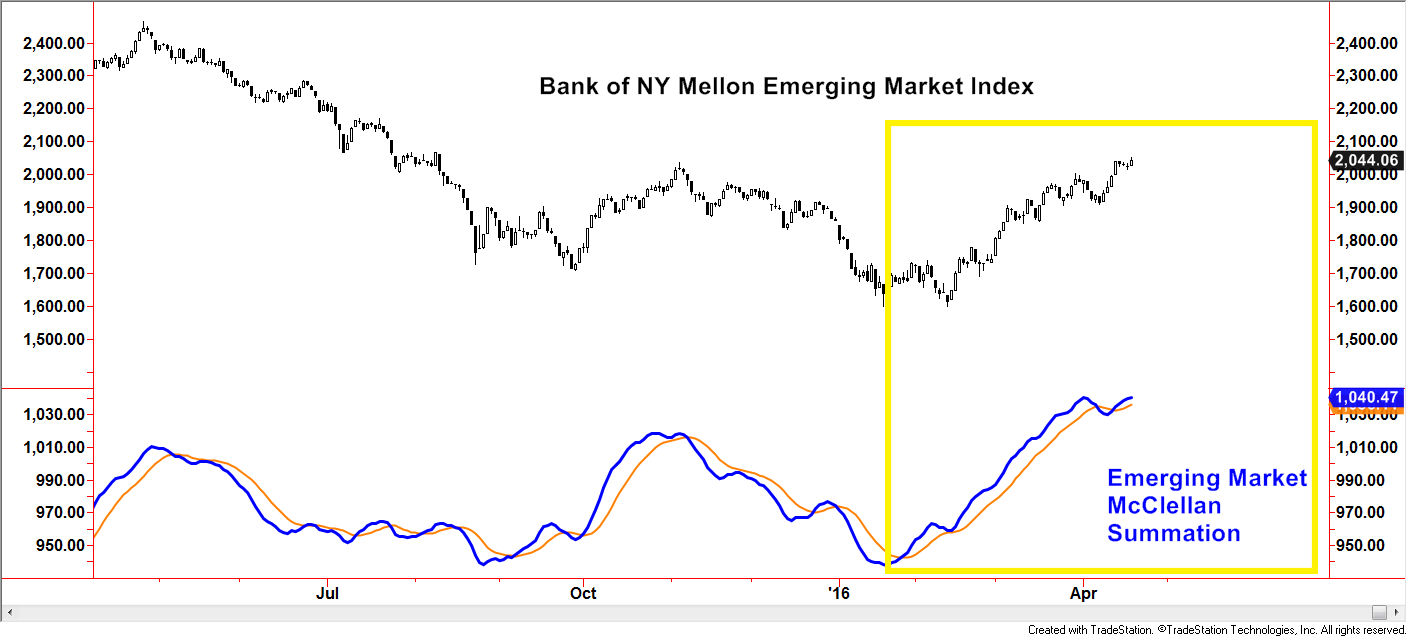
The McClellan Summation is a common breadth indicator that measures the momentum of advancing issues to declining issues. Logically, a lower number of components carrying the performance burden would assume to have lower odds of maintaining that supportive role for very long before failing. So, users of this indicator attempt to determine if an index may be rising due to only a few issues or if the workload is being more broadly spread out among the indexes’ components.
The Emerging Market McClellan Summation indicator has been generally rising since late January of this year, shown in the chart below.
Its improvement sent the message that the components were getting more organized, so to speak. This breadth indicator was able to add another piece to the puzzle which we would not have if looking only at the price movement of the Emerging Market Index. Bullish clues from this indicator occurred well ahead of the very recent break above the downtrend line of the MSCI All Country World Index as seen in the first chart at the beginning of the article.
Final Conclusion: Clues give market insight
Insight: the capacity to gain an accurate and deep intuitive understanding of a person or thing.
First and foremost, investment risks associated with downtrends should not be under-estimated. However, clues may exist that can help investors further define if the odds of potential reward are high enough to become invested- to some degree- versus not participating at all until a “new” obvious trend change is seen. If you want to know why this could be important, please contact our office and we would be happy to talk with you.
Disclosures
MSCI All Country World Index (MXWD) is a capitalization weighted index that monitors the performance of stocks from around the world.
Standard and Poor’s 500 TR Index (S&P500) is a capitalization-weighted index of 500 stocks representing all major industries.
Bank of New York Mellon Emerging Markets 50 ADR Index. The Index is capitalization-weighted and designed to track the performance of approximately 50 emerging market-based depositary receipts.
Bank of New York Mellon Developed Markets 100 ADR Index. The Index is capitalization-weighted and designed to track the performance of approximately 100 developed market-based depositary receipts.
This writing is for informational purposes only and does not constitute an offer to sell, a solicitation to buy, or a recommendation regarding any securities transaction, or as an offer to provide advisory or other services by Spectrum Financial, Inc. in any jurisdiction in which such offer, solicitation, purchase or sale would be unlawful under the securities laws of such jurisdiction. The information contained in this writing should not be construed as financial or investment advice on any subject matter. Spectrum Financial, Inc. expressly disclaims all liability in respect to actions taken based on any or all of the information on this writing. For full disclosure please see disclosures page here.


