Tag: Wall Street Myth vs. Market Reality

Wall Street Myth vs. Market Reality II

Years ago, a big box office supply store came up with the slogan, “that was easy”. I have even seen plastic battery powered buttons that vocalize the phrase when pressed.  Wall Street and many individual investors have adopted this concept when incorporating chart analysis to the investment process.  A myth I have heard for years is, “there’s nothing more bullish than a breakout to new highs”.  Like all myths, there is some truth in the statement.

Believing successful investing is as simple as buying breakouts and selling breakdowns can be a dangerous endeavor.

Back in late October 1987, I was stinging from recent losses in the stock market from that fateful day a week or two earlier. With a bruised ego but determination, I perused a local bookstore and found “Secrets for Profiting in Bull and Bear Markets” by Stan Weinstein.  The market’s crash through support levels and uptrend lines meant the beginning of a bear market – everybody knows that! Right?  After reading the book, a bright light emitted forth from the pages and I could hear the angels singing.  As it turned out, the book was my first look at Technical Analysis, or, using charts to gauge future possible movements.  Patterns such as Head & Shoulders Tops and Double Bottoms, were detailed, as well as the basics of moving averages.  My thirst for knowledge was unquenched so I bought another book, “Technical Analysis of Stock Trends” by Edwards and Magee.  First published in 1948, many consider it a foundational work for Technical Analysis as it has over 600 pages dedicated to chart patterns and trend lines and the phenomenon of how crowd psychology is conveyed in the patterns.  For decades, the concepts in these books as well as numerous others have been learned by the public, professional and non-professional.  Examples in the books and in real time, in my opinion, supported the theories of how chart patterns and basic tools such as moving averages and trend lines can play helpful roles within investing.  Remember, myths are usually based on some degree of fact.

So much of Technical Analysis is based on human reactions that reoccur throughout time in strikingly similar ways. From the early days of the investment markets until the mid-2000’s, investors received information at different rates.  Newspapers provided quotes and stories that could spark investor reaction.  Institutions had quick access to information through the best available technology.  Many, if not most investors had stock and bond brokers with various levels of speed regarding news through the use of ticker tapes early on and later, through rudimentary computers.  Brokers could reach only so many of their clients in a day and even then, there was probably some pecking order in which larger clients were called first.  This sort of flow of information was at the core of how many, if not most, chart patterns were created and did so with enough reliability to spawn chart analysis as a worthwhile endeavor to pursue.

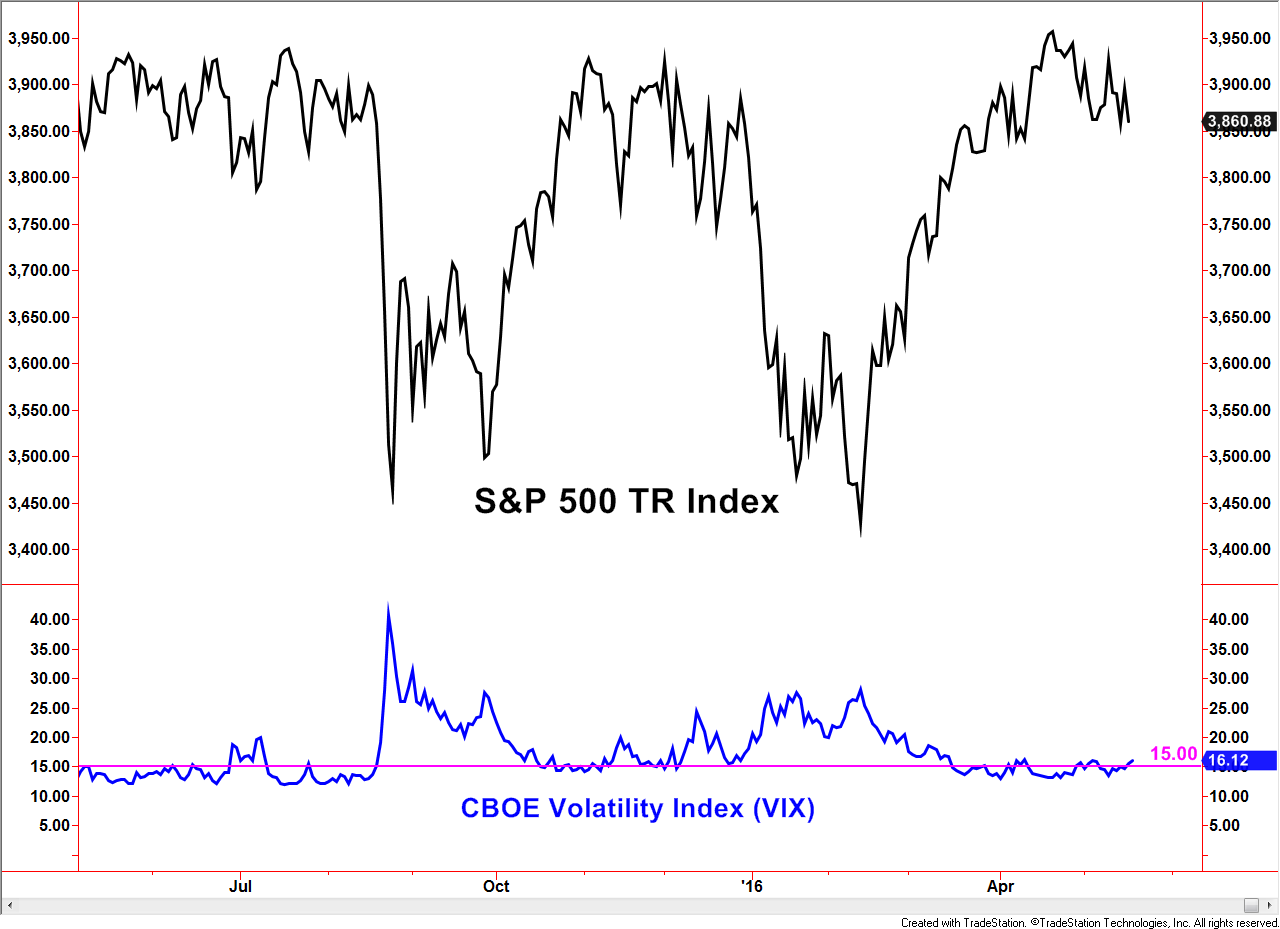
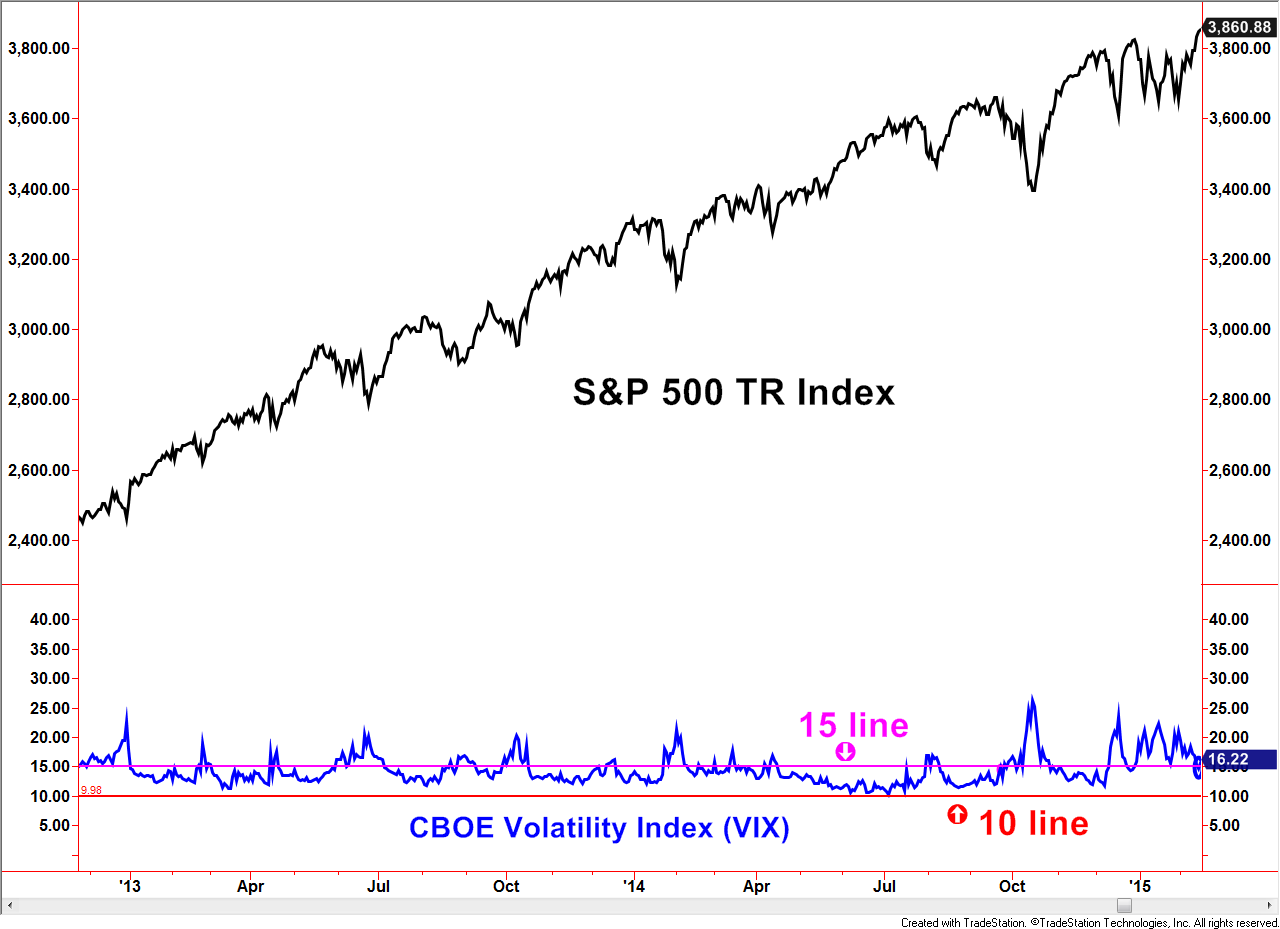
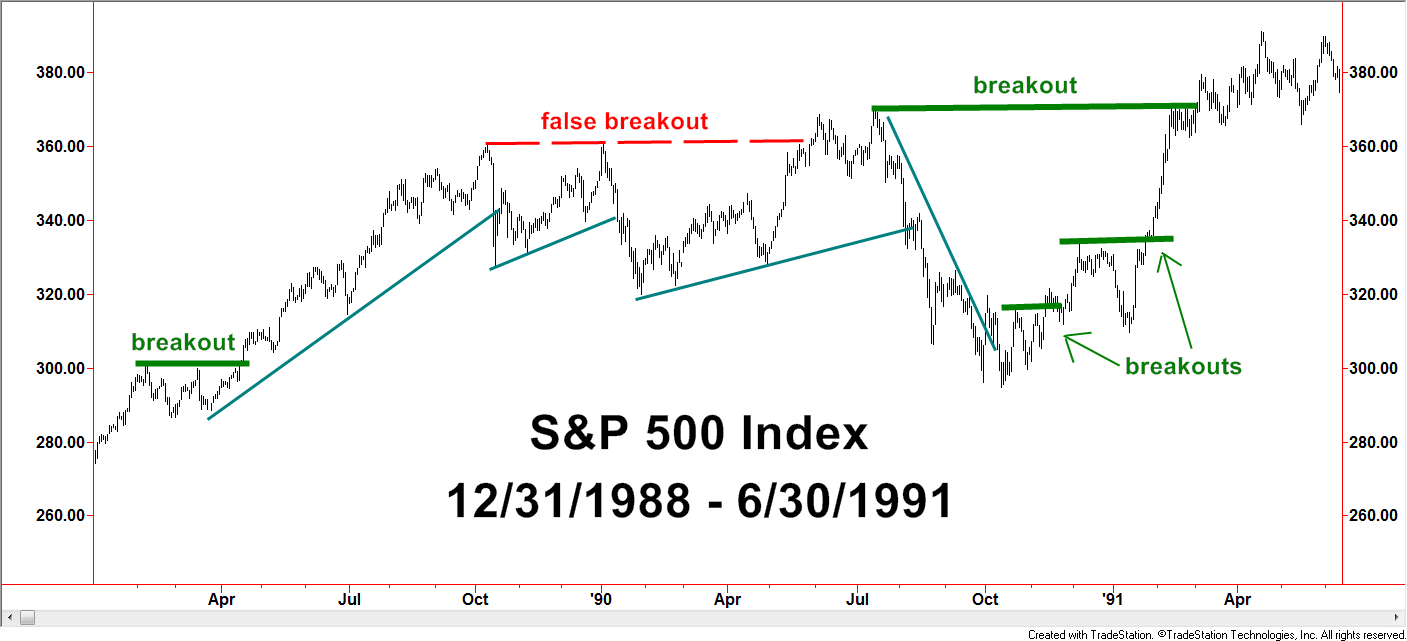
Before 2000 there was a greater tendency of follow-through after break outs.” – Chart below

Breakout pre 2000Created with TradeStation. © TradeStation Technologies, Inc.  All rights reserved.

A “breakout” is perhaps the most well-known Technical Analysis 101 concept, repeated so often even investors that focus on non-charting methods know what a breakout is. The logic is that when a stock (index, bond, commodity, etc), breaks out of a trading range and to a new short-term or longer-term high, investors naturally have a favorable perspective towards it.  Whether true or not, a stock making new highs is commonly perceived to represent a company doing something right, something enough to attract the attention and money of investors.  Additionally, breaks to new highs lack the potential selling pressure of those waiting to sell at breakeven levels – a commonly held belief based on logic and past observation.  With the psychology of a breakout covered, now the more mechanical side of the picture can be covered.  The news flow process detailed earlier comes into play regarding how patterns develop.  The initial surge has to start someplace.  The strongest argument, at least for the pre-2000ish time frame, is that breakouts from sideways patterns occur out of fundamental or company specific news events.  Perhaps that is not always the case but mostly.  Buying demand is the fuel that propels stocks higher.  Such demand builds as news flows from the better informed to the lesser informed.  This used to take days or even weeks.  Can you now picture the wave of demand working into a stock, propelling it higher?  No wonder people have believed there is nothing more bullish than a stock breaking out to new highs!

Or is there?

For decades and decades, pattern development and analysis relied on how information flowed to those putting in the buy or sell orders. That all changed with the development and public adoption of the internet and also with some regulatory changes.  Today, information flow has become lightning fast and available to most all parties.  Fast, non-discriminating data and news has had a major impact to chart pattern analysis.  Without a governor on the speed of information, investor reaction is so swift that traditional patterns have changed shape or are no longer seen.

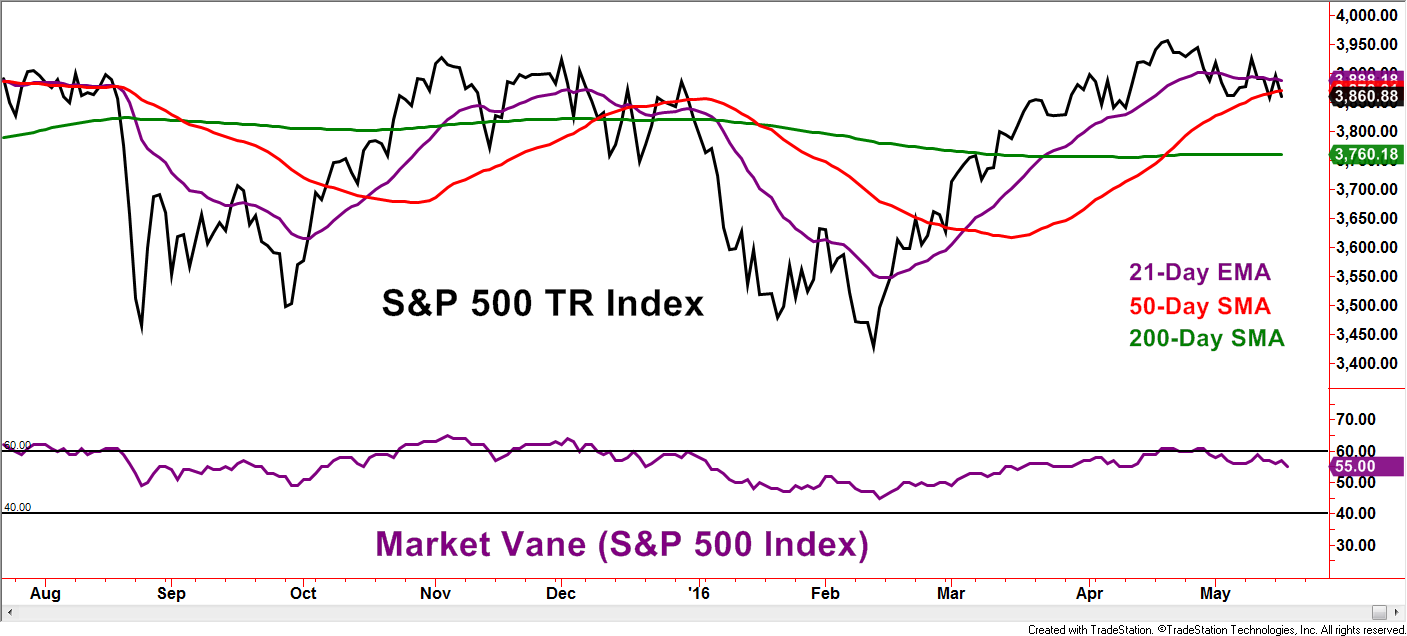
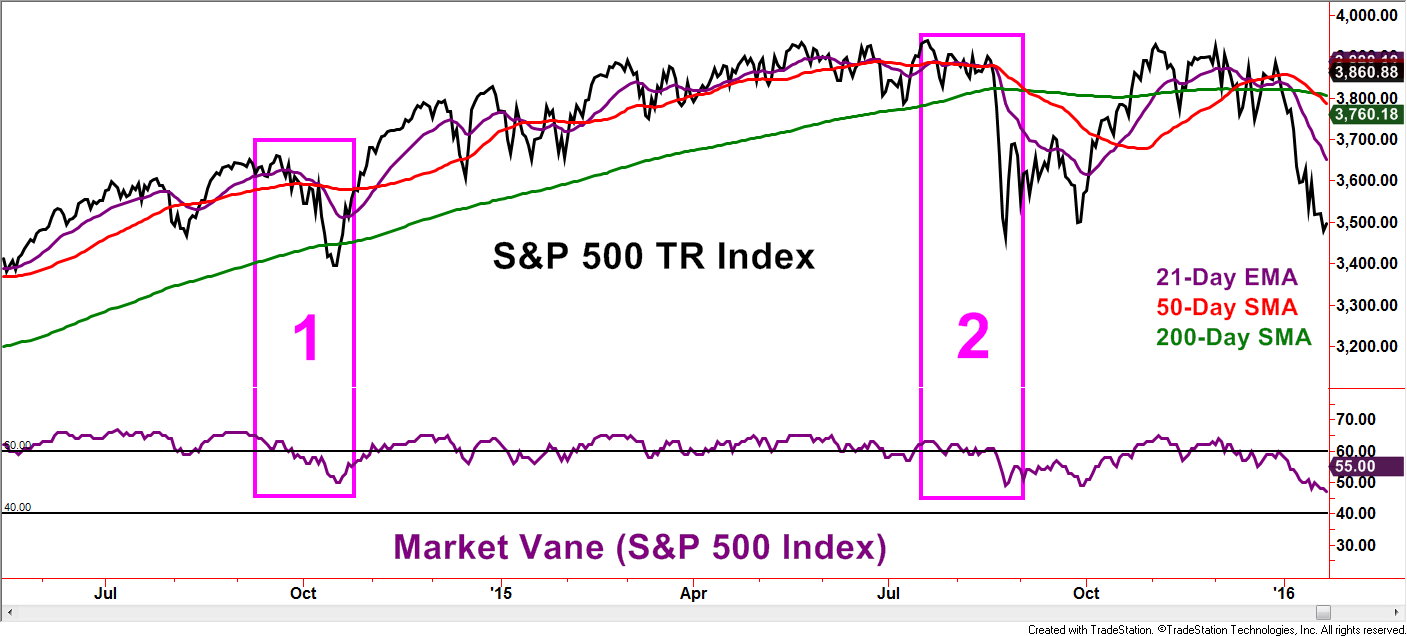
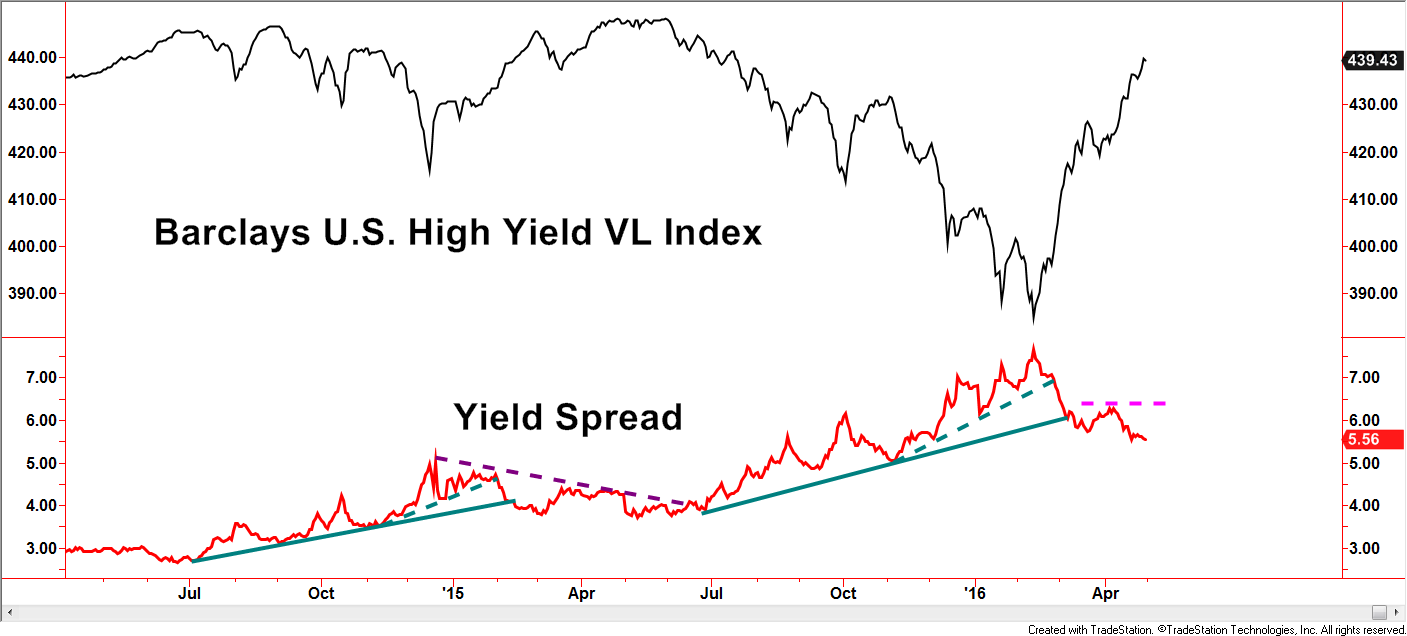
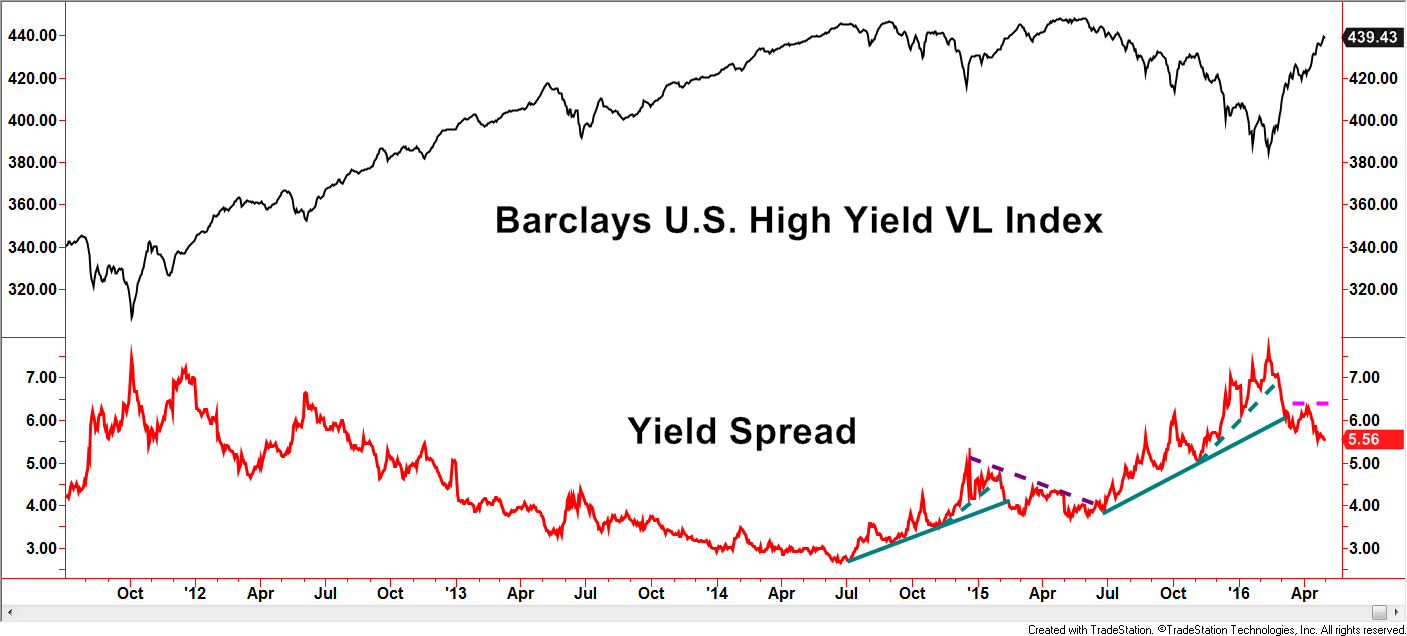
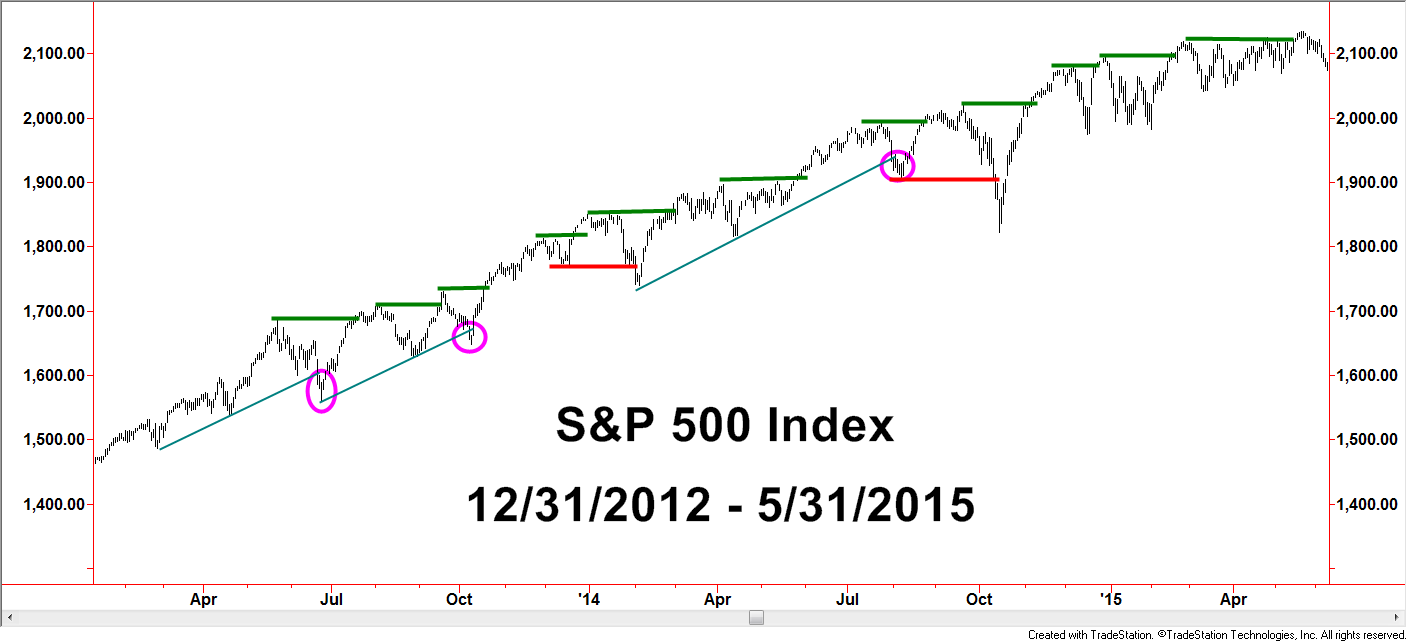
Currently buying breakouts and selling break downs or trend line breaks can be disastrous.”  – Chart below

Breakout post 2000Created with TradeStation. © TradeStation Technologies, Inc.  All rights reserved.

Breakout/breakdown and trend line traders that relied on slower-to-the-party investors no longer have the underlying logic to support such methods with the level of reliability seen years ago. With so much more intense buying demand compressed in such a short time frame, investors with the technology available to see the movements may attain profits so quickly that selling demand can now come from those with the quick profits – bought days, minutes, seconds, or micro-seconds earlier.  Who are those people with the technology that can allow them to see their stocks move up so quickly?

EVERYBODY! We all have access to this information through our computers, cell phones, and tablets.  There is a sense of irony that the very technology allowing investors to trade their own account has played a major impact in increasing the difficulty of analysis.

Most of these concepts can be transferred to other long-standing introductory charting concepts. One is the long-standing assumption that breakdowns below support are warnings of additional negatives to come.  Trend line analysis also changed character tremendously since the information flow alteration of the internet.  Technical analysis indicators and methodologies are primary components to active portfolio management but relying on breakouts and breakdowns or trend line breaks to be a simple path to success is a Wall Street myth.

Disclosures

S&P 500 TR Index: is a capitalization weighted index of 500 stocks representing all major domestic industry groups and assumes the reinvestment of dividends and capital gains. It is not possible to directly invest in any index.

This writing is for informational purposes only and does not constitute an offer to sell, a solicitation to buy, or a recommendation regarding any securities transaction, or as an offer to provide advisory or other services by Spectrum Financial, Inc. in any jurisdiction in which such offer, solicitation, purchase or sale would be unlawful under the securities laws of such jurisdiction. The information contained in this writing should not be construed as financial or investment advice on any subject matter. Spectrum Financial, Inc. expressly disclaims all liability in respect to actions taken based on any or all of the information on this writing.  For full disclosure please see disclosures page here.

Wall Street Myth vs. Market Reality

Myths are stories that often have some element of truth in origin, but over time, take on untrue characteristics. Wall Street is no exception as investors often hold tight to methods that appear to be helpful short-cuts to wealth but often fail when viewed from other angles.  At the beginning of the year, investors talked up the “January Barometer” as this year’s selloff in January supposedly would forecast a bad 2016.  The Super Bowl winner, coming from the AFC or NFC, can predict performance.  Another story this time of year is, “sell in May and go away”.  The moving average Death Cross and the Hindenburg Omen are other popular yet dubious Wall Street myths.  Investor sentiment is a broad category that spawns numerous myths.  At the core of many of these is the belief that bullishness is tied at the hip with low volatility and when together, they display a high degree of optimism, then leading the market to collapse.

Myth:  Bullishness tied with extended low volatility leads to market collapse

Sentiment can be measured in many ways. This discussion will cover only a few sentiment measures for the stock and bond market.  Major categories citing investor sentiment include surveys, volatility, and spreads.

Market Vane Created with TradeStation ©TradeStation Technologies, Inc. All rights reserved

Market Vane is an organization that surveys investors, tracking if the respondents are bullish or bearish toward specific stock market indexes and other investment choices. Readings at 50 convey a 50% response of bullishness and thus a neutral reading.  Levels above 70% bullishness have not been seen since 2007, so above 60% is a modern interpretation of extreme bullishness.  Notice how the Market Vane readings above 60 appeared to have stopped the S&P 500 Total Return Index in its tracks back in November and December 2015 and again as recently as April of this year.  The evidence presented in this chart supports the idea that extremes in bullishness mark highs in the stock market.

Market Vane 2Created with TradeStation ©TradeStation Technologies, Inc. All rights reserved

Now let’s go back to late 2014 and the summer of 2015. Points 1 and 2, respectively, display sharp market corrections.  Did the correction occur following extreme bullish readings from the Market Vane S&P 500 Index survey?  Absolutely!  As mentioned earlier, myths are often founded in some element of fact and that was the case for these two examples.  However, like the boy who cried wolf, extreme investor bullishness was visible for many months prior to the corrections as the S&P 500 worked higher.  This is just one example but the claim of extreme bullishness warning of an impending market correction may have a nugget of truth, but care needs to be given when embracing the message as immediately useful.  If the Market Vane reading reaches over 60 in the future, odds favor that we will once again hear the myth of a market correction being at our doorstep.

Another popular measure of investor sentiment is the CBOE Volatility Index, commonly referred to as the “VIX” – most data vendors have the letters V-I-X within their version of the symbol. Generally speaking, the VIX conveys the implied volatility component embedded with S&P 500 Index options.  While the VIX is by far the most popular, this measure exists for numerous indexes and investment choices.  Investors eager to buy options during periods of increased volatility tend to pay inflated option premiums relative to periods of lower volatility.  Think of it like how someone seeking hurricane insurance as a storm approaches would likely pay higher insurance premiums than if no storm was predicted.  Therefore, the VIX tends to decline as investors become more bullish and rise as investors become more fearful.  This explains why the VIX is also called the “Fear Index or Indicator”.

CBOE Volatility IndexCreated with TradeStation ©TradeStation Technologies, Inc. All rights reserved

The myth is that a low VIX precedes market corrections.

Remember, the word “myth” is not being defined as outright false but has a measure of false or exaggerated claims.  The chart above supports the myth in multiple periods.  The lower portion of the chart displays a horizontal line at the 15 level, what many would claim as a low number historically – at least according to myth.  Sub-15 readings preceded the S&P 500 TR Index corrections in August, 2015, January 2016, and the loss of momentum in April to present May.

CBOE Volatility Index 2Created with TradeStation ©TradeStation Technologies, Inc. All rights reserved

Now let’s go back to 2013 through 2014. The VIX not only reached below 15 but stayed under that line for months at a time while the S&P 500 TR Index continued higher.  Not shown, but this was also the case during the bull market environment from 2005 through the first half of 2007.

Yield SpreadCreated with TradeStation ©TradeStation Technologies, Inc. All rights reserved

Next stop is a sentiment gauge within the bond market, specifically the high yield market. The yield spread measures yields from treasuries, usually the 10-year T-Bond, versus high yield bonds.  Spreads widen when investor fears heighten, sometimes for valid, longer-term reasons and sometimes for short-lived, emotional ones.  Ideally, a favorable environment has declining trends in yield spreads which is the case currently.  With this example, we will avoid directly noting a widespread myth but some common concerns are to be addressed.  In the first half of 2015, yield spreads were falling as the high yield index rose to test the previous highs from mid/late 2014.  The fast rise and perceived resistance would have been reasonable concerns brought up by investors. Those concerns alone, however, would have provided a flimsy argument despite the accuracy evident by the failure of the trend.  So far in 2016, the high yield index has accelerated sharply and is now near potential resistance of the previous highs – a very similar situation to early 2015.  Using this level of the yield spread as a gauge of investor bullishness, its current level is not sending the message of over-exuberance.

Yield Spread 2Created with TradeStation ©TradeStation Technologies, Inc. All rights reserved

If we turn our attention to a longer-term chart, the current yield spread in the mid-5’s is not only far from the lowest levels, but lower levels can be maintained for long periods of time while uptrends in the high yield market persist.

Clues brought to our attention by various sources should not be totally disregarded, but myths tend to persist because many are taken at face value as being true.

In the three examples presented, arguments can be made that warrant attention in the current market environment, based on successful but narrowly focused historical examples.  Savvy investors develop habits of investigation and research that often bust long-held Wall Street myths.

Disclosures

S&P 500 TR Index: is a capitalization weighted index of 500 stocks representing all major domestic industry groups and assumes the reinvestment of dividends and capital gains. It is not possible to directly invest in any index.

Barclays US High Yield Very Liquid Index: This benchmark includes publicly issued U.S. dollar denominated non-investment grade, fixed-rate taxable corporate bonds that have a remaining maturity of at least one year, regardless of optionality. The bonds are rated high yield (Ba1/BB+/BB+ or below) using the middle rating of Moody’s, S&P, and Fitch, respectively (before July 1, 2005, the lower of Moody’s and S&P was used). Included issues consist of only the three largest bonds from each issuer that has a minimum amount outstanding of $500 million or more (face value) and less than five years from issue date.

This writing is for informational purposes only and does not constitute an offer to sell, a solicitation to buy, or a recommendation regarding any securities transaction, or as an offer to provide advisory or other services by Spectrum Financial, Inc. in any jurisdiction in which such offer, solicitation, purchase or sale would be unlawful under the securities laws of such jurisdiction. The information contained in this writing should not be construed as financial or investment advice on any subject matter. Spectrum Financial, Inc. expressly disclaims all liability in respect to actions taken based on any or all of the information on this writing.  For full disclosure please see disclosures page here.

Spectrum Financial, Inc 2023