Years ago, a big box office supply store came up with the slogan, “that was easy”. I have even seen plastic battery powered buttons that vocalize the phrase when pressed. Wall Street and many individual investors have adopted this concept when incorporating chart analysis to the investment process. A myth I have heard for years is, “there’s nothing more bullish than a breakout to new highs”. Like all myths, there is some truth in the statement.
Believing successful investing is as simple as buying breakouts and selling breakdowns can be a dangerous endeavor.
Back in late October 1987, I was stinging from recent losses in the stock market from that fateful day a week or two earlier. With a bruised ego but determination, I perused a local bookstore and found “Secrets for Profiting in Bull and Bear Markets” by Stan Weinstein. The market’s crash through support levels and uptrend lines meant the beginning of a bear market – everybody knows that! Right? After reading the book, a bright light emitted forth from the pages and I could hear the angels singing. As it turned out, the book was my first look at Technical Analysis, or, using charts to gauge future possible movements. Patterns such as Head & Shoulders Tops and Double Bottoms, were detailed, as well as the basics of moving averages. My thirst for knowledge was unquenched so I bought another book, “Technical Analysis of Stock Trends” by Edwards and Magee. First published in 1948, many consider it a foundational work for Technical Analysis as it has over 600 pages dedicated to chart patterns and trend lines and the phenomenon of how crowd psychology is conveyed in the patterns. For decades, the concepts in these books as well as numerous others have been learned by the public, professional and non-professional. Examples in the books and in real time, in my opinion, supported the theories of how chart patterns and basic tools such as moving averages and trend lines can play helpful roles within investing. Remember, myths are usually based on some degree of fact.
So much of Technical Analysis is based on human reactions that reoccur throughout time in strikingly similar ways. From the early days of the investment markets until the mid-2000’s, investors received information at different rates. Newspapers provided quotes and stories that could spark investor reaction. Institutions had quick access to information through the best available technology. Many, if not most investors had stock and bond brokers with various levels of speed regarding news through the use of ticker tapes early on and later, through rudimentary computers. Brokers could reach only so many of their clients in a day and even then, there was probably some pecking order in which larger clients were called first. This sort of flow of information was at the core of how many, if not most, chart patterns were created and did so with enough reliability to spawn chart analysis as a worthwhile endeavor to pursue.
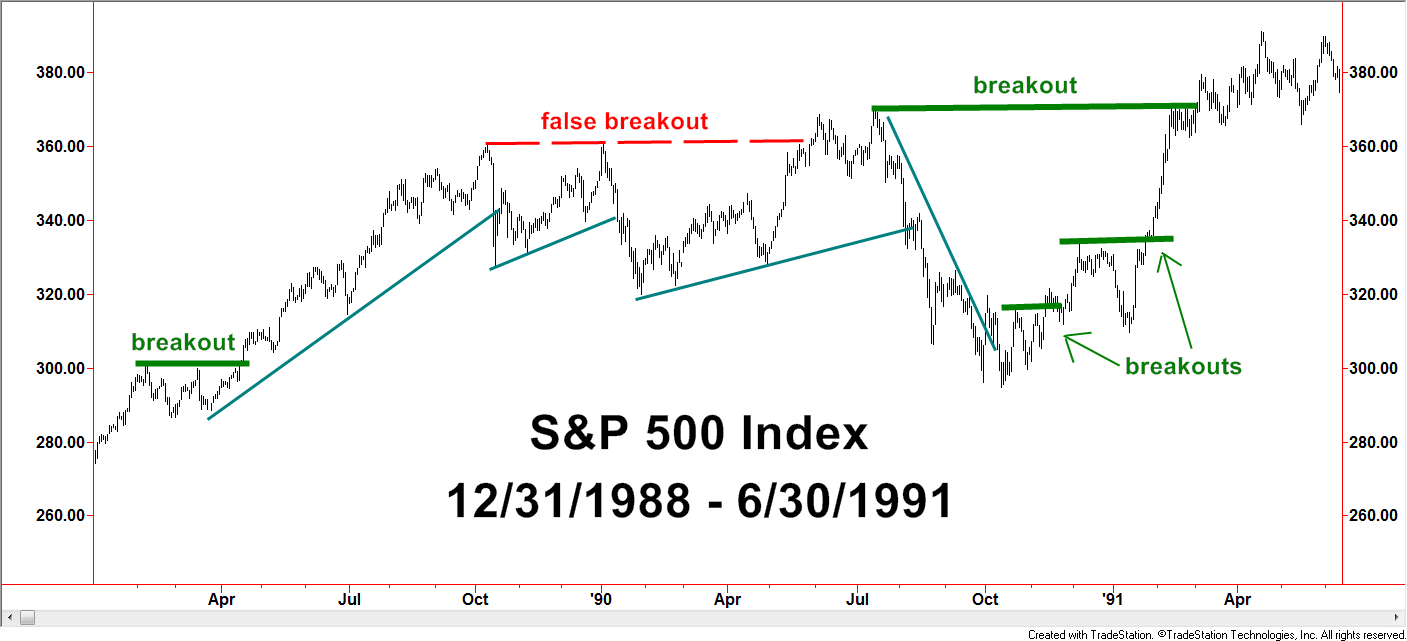
Before 2000 there was a greater tendency of follow-through after break outs.” – Chart below
 Created with TradeStation. © TradeStation Technologies, Inc. All rights reserved.
A “breakout” is perhaps the most well-known Technical Analysis 101 concept, repeated so often even investors that focus on non-charting methods know what a breakout is. The logic is that when a stock (index, bond, commodity, etc), breaks out of a trading range and to a new short-term or longer-term high, investors naturally have a favorable perspective towards it. Whether true or not, a stock making new highs is commonly perceived to represent a company doing something right, something enough to attract the attention and money of investors. Additionally, breaks to new highs lack the potential selling pressure of those waiting to sell at breakeven levels – a commonly held belief based on logic and past observation. With the psychology of a breakout covered, now the more mechanical side of the picture can be covered. The news flow process detailed earlier comes into play regarding how patterns develop. The initial surge has to start someplace. The strongest argument, at least for the pre-2000ish time frame, is that breakouts from sideways patterns occur out of fundamental or company specific news events. Perhaps that is not always the case but mostly. Buying demand is the fuel that propels stocks higher. Such demand builds as news flows from the better informed to the lesser informed. This used to take days or even weeks. Can you now picture the wave of demand working into a stock, propelling it higher? No wonder people have believed there is nothing more bullish than a stock breaking out to new highs!
Or is there?
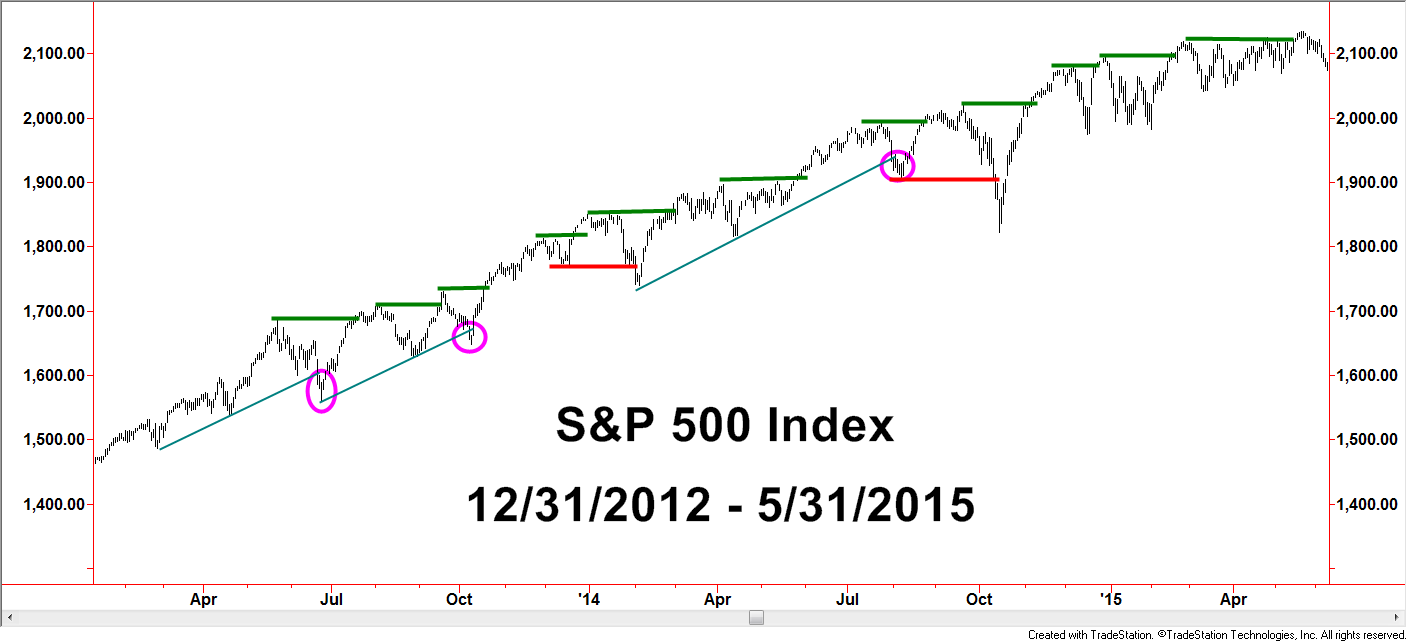
For decades and decades, pattern development and analysis relied on how information flowed to those putting in the buy or sell orders. That all changed with the development and public adoption of the internet and also with some regulatory changes. Today, information flow has become lightning fast and available to most all parties. Fast, non-discriminating data and news has had a major impact to chart pattern analysis. Without a governor on the speed of information, investor reaction is so swift that traditional patterns have changed shape or are no longer seen.
Currently buying breakouts and selling break downs or trend line breaks can be disastrous.” – Chart below
 Created with TradeStation. © TradeStation Technologies, Inc. All rights reserved.
Breakout/breakdown and trend line traders that relied on slower-to-the-party investors no longer have the underlying logic to support such methods with the level of reliability seen years ago. With so much more intense buying demand compressed in such a short time frame, investors with the technology available to see the movements may attain profits so quickly that selling demand can now come from those with the quick profits – bought days, minutes, seconds, or micro-seconds earlier. Who are those people with the technology that can allow them to see their stocks move up so quickly?
EVERYBODY! We all have access to this information through our computers, cell phones, and tablets. There is a sense of irony that the very technology allowing investors to trade their own account has played a major impact in increasing the difficulty of analysis.
Most of these concepts can be transferred to other long-standing introductory charting concepts. One is the long-standing assumption that breakdowns below support are warnings of additional negatives to come. Trend line analysis also changed character tremendously since the information flow alteration of the internet. Technical analysis indicators and methodologies are primary components to active portfolio management but relying on breakouts and breakdowns or trend line breaks to be a simple path to success is a Wall Street myth.
Disclosures
S&P 500 TR Index: is a capitalization weighted index of 500 stocks representing all major domestic industry groups and assumes the reinvestment of dividends and capital gains. It is not possible to directly invest in any index.
This writing is for informational purposes only and does not constitute an offer to sell, a solicitation to buy, or a recommendation regarding any securities transaction, or as an offer to provide advisory or other services by Spectrum Financial, Inc. in any jurisdiction in which such offer, solicitation, purchase or sale would be unlawful under the securities laws of such jurisdiction. The information contained in this writing should not be construed as financial or investment advice on any subject matter. Spectrum Financial, Inc. expressly disclaims all liability in respect to actions taken based on any or all of the information on this writing. For full disclosure please see disclosures page here.
